All Templates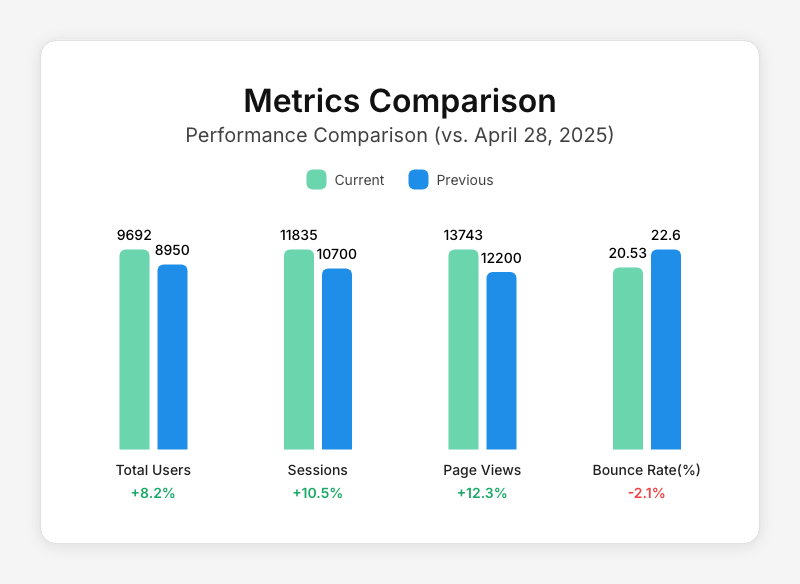
Comparison Graph Image
Create sleek Comparison Bar Graph Image with your data
- 100% customizable in the editor
- Render via API, Zapier, Make & n8n
- Export PNG, JPG, PDF & MP4
- Generate at scale from a spreadsheet
- Remix it with the AI design agent
01
Start from this template
Skip the blank canvas — this design is ready to make your own.
02
Customize it free
Edit text, colors and images in the Orshot editor in minutes.
03
Render or automate
Export instantly, or generate at scale via API, Zapier, Make & n8n.
Integrations
Automate this template using integrations
For developers
Backend Usage
You can generate Comparison Graph Image renders using Rest API and Orshot SDKs
await fetch("https://api.orshot.com/v1/generate/images", {
  method: "POST",
  headers: {
    "Content-Type": "application/json",
    Authorization: "Bearer <ORSHOT_API_KEY>",
  },
  body: JSON.stringify({
    "templateId": "comparison-graph",
    "response": {
      "format": "png",
      "type": "base64"
      "scale": 1
    },
    "modifications": {
      "title": "Metrics Comparison",
      "titleColor": "#111",
      "description": "Performance Comparison (vs. April 28, 2025)",
      "descriptionColor": "#444",
      "icon": "https://pika.style/icons/pika-filled-squared-120.png",
      "metricNames": "Total Users, Sessions, Page Views, Bounce Rate(%)",
      "currentValues": "9692, 11835, 13743, 20.53",
      "previousValues": "8950, 10700, 12200, 22.6",
      "changeValues": "+8.2%, +10.5%, +12.3%, -2.1%",
      "metricNameColor": "#222",
      "currentValueColor": "#000",
      "previousValueColor": "#000",
      "barPrimaryColor": "#6BD6AD",
      "barSecondaryColor": "#1F8EE8",
      "graphBackgroundColor": "#fff",
      "backgroundColor": "#f5f5f5",
      "width": "800",
      "padding": "40"
    }
  }),
});
Modifications
You can customize the template using following modifications
| Key | Description | Type |
|---|---|---|
| title | Chart Title | string |
| titleColor | CSS Color Value for Title | string |
| description | Chart Description or Subtitle | string |
| descriptionColor | CSS Color Value for Description | string |
| icon | Icon of your product or service (direct link to icon or base64) | string |
| metricNames | Comma-separated list of metric names | string |
| currentValues | Comma-separated list of current metric values | string |
| previousValues | Comma-separated list of previous metric values | string |
| changeValues | Comma-separated list of change percentages (include + or - signs) | string |
| metricNameColor | CSS Color Value for Metric Names | string |
| currentValueColor | CSS Color Value for Current Values | string |
| previousValueColor | CSS Color Value for Previous Values | string |
| barPrimaryColor | CSS Color Value for the Metric Bars | string |
| barSecondaryColor | CSS Color Value for the Previous Period Bars | string |
| graphBackgroundColor | CSS Color Value for the Chart Background | string |
| backgroundColor | CSS Color Value for the Image Background | string |
| width | Width of output image | number |
| padding | Spacing around the chart | number |