All Templates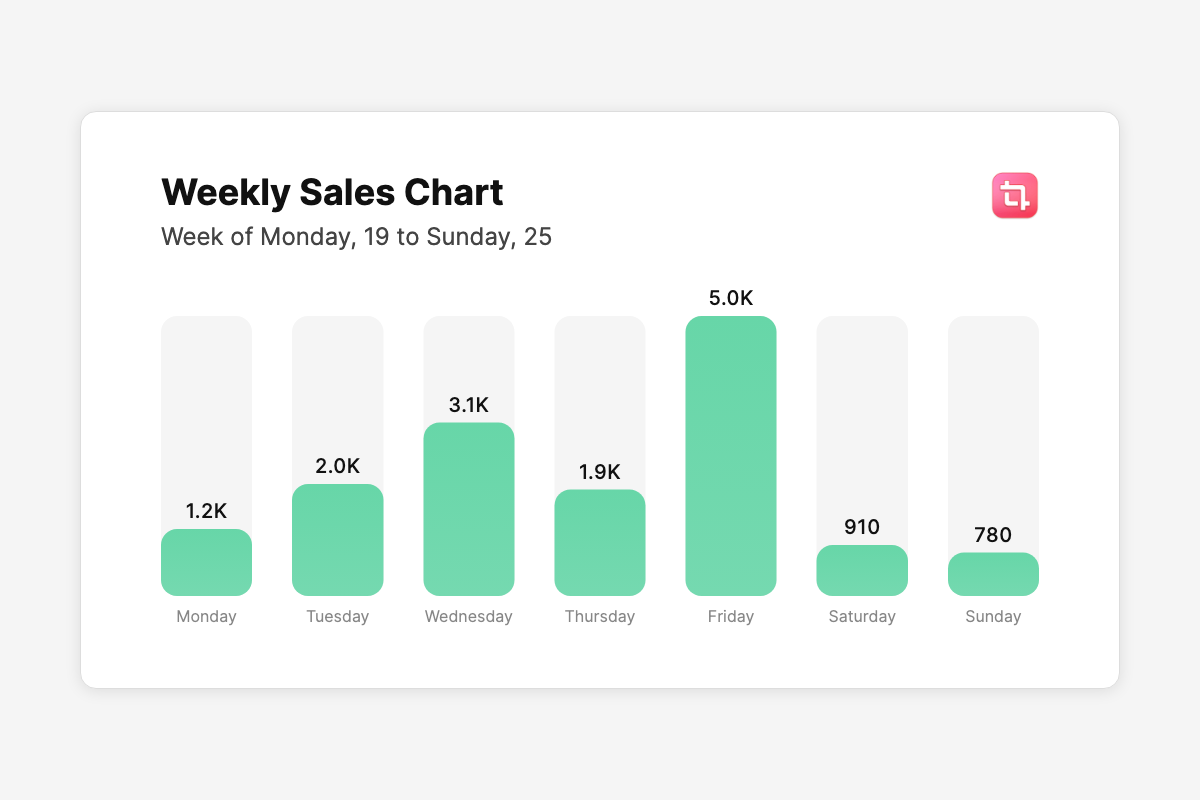
Bar Graph Image
Create sleek Bar Graph Image with your data
- 100% customizable in the editor
- Render via API, Zapier, Make & n8n
- Export PNG, JPG, PDF & MP4
- Generate at scale from a spreadsheet
- Remix it with the AI design agent
Automate
Automate this template via API & Agents
Render PNG, PDF and WebP via API, n8n, Make, Zapier or an AI agent.
1Trigger
Receiving data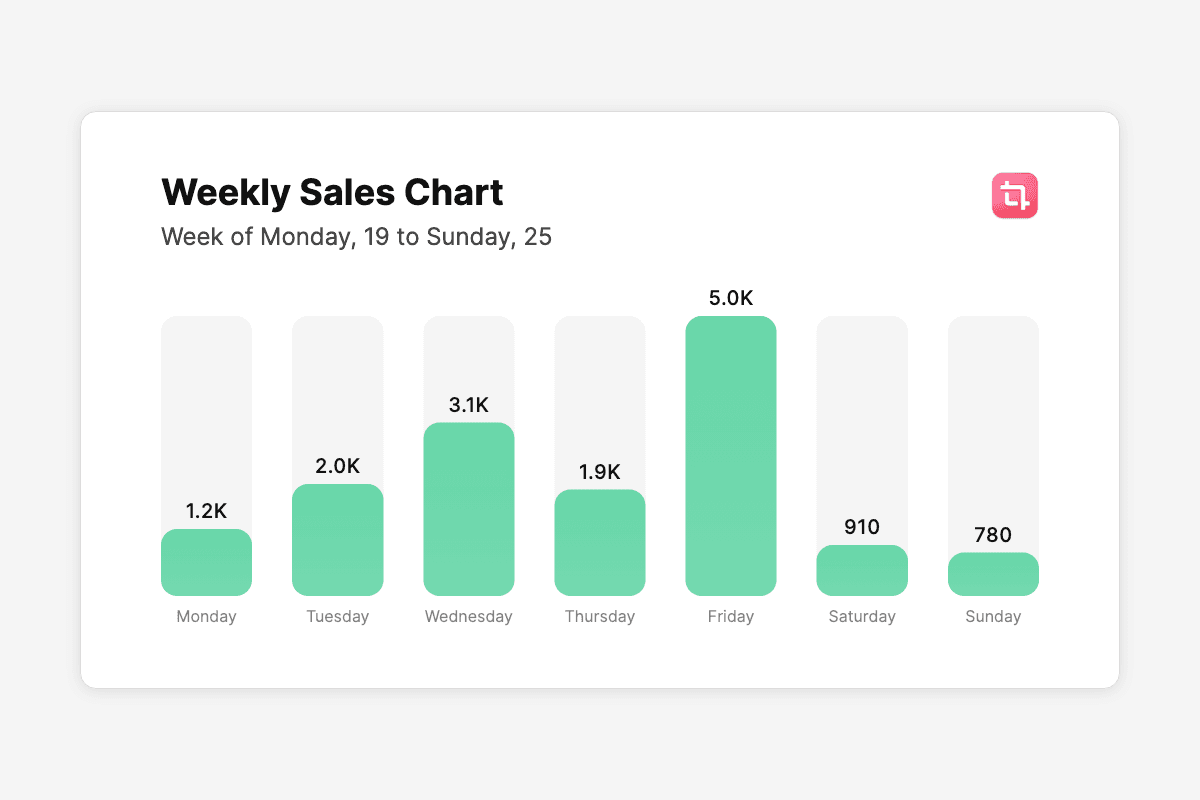
Bar Graph Image template
- title
- Weekly Sales Chart
- titleColor
- #111
- description
- Week of Monday,…
3Render and deliver
 Instagrambar-graph-image.pngpng
- Your backendbar-graph-image.pdfpdf
 LinkedInbar-graph-image.webpwebp
01
Start from this template
Skip the blank canvas — this design is ready to make your own.
02
Customize it free
Edit text, colors and images in the Orshot editor in minutes.
03
Render or automate
Export instantly, or generate at scale via API, Zapier, Make & n8n.
For developers
Backend Usage
You can generate Bar Graph Image renders using Rest API and Orshot SDKs
await fetch("https://api.orshot.com/v1/generate/images", {
  method: "POST",
  headers: {
    "Content-Type": "application/json",
    Authorization: "Bearer <ORSHOT_API_KEY>",
  },
  body: JSON.stringify({
    "templateId": "simple-bar-graph",
    "response": {
      "format": "png",
      "type": "base64",
      "scale": 1
    },
    "modifications": {
      "title": "Weekly Sales Chart",
      "titleColor": "#111",
      "description": "Week of Monday, 19 to Sunday, 25",
      "descriptionColor": "#444",
      "icon": "https://pika.style/icons/pika-filled-squared-120.png",
      "padding": "80",
      "labels": "Monday, Tuesday, Wednesday, Thursday, Friday, Saturday, Sunday",
      "values": "1200, 2000, 3100,1900, 5000, 910, 780",
      "graphBackgroundColor": "#fff",
      "barPrimaryColor": "linear-gradient(to top, #75d9b0, #67d6a8)",
      "barFallbackColor": "#f5f5f5",
      "labelColor": "#111",
      "backgroundColor": "#f5f5f5",
      "backgroundImageUrl": " ",
      "width": "1200",
      "height": "800"
    }
  }),
});
Modifications
You can customize the template using following modifications
| Key | Description | Type |
|---|---|---|
| title | Graph Title | string |
| titleColor | CSS Color Value for Title | string |
| description | Graph Description | string |
| descriptionColor | CSS Color Value for Description | string |
| icon | Icon of your product or service(direct link to icon or base64) | string |
| padding | Spacing around the graph | number |
| labels | String of labels separated by commas for the graph(should match number of values), should be in the same format as in example | string |
| values | String of values separated by commas for the graph, should be in the same format as in example | string |
| graphBackgroundColor | CSS Color Value for Graph's background | string |
| barPrimaryColor | CSS Color Value for Bar Foreground | string |
| barFallbackColor | CSS Color Value for Bar Background | string |
| labelColor | CSS Color Value for Labels | string |
| backgroundColor | HEX Color Code for background | string |
| backgroundImageUrl | Link to background image | string |
| width | Width of output image | number |
| height | Height of output image | number |