What analytics does the embed show?
Every number, table and label in the embed Analytics tab, what each one counts and what is recorded.
Updated
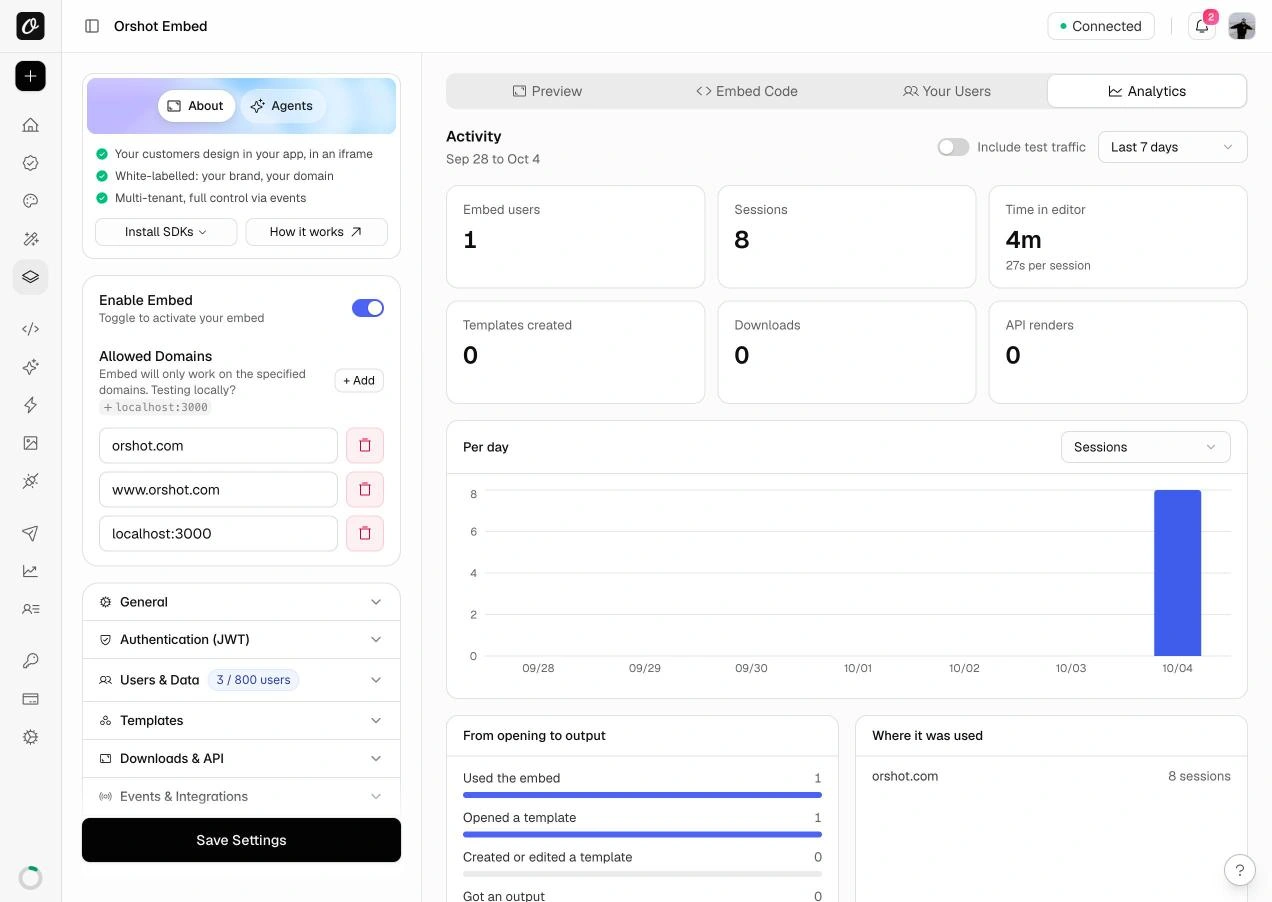
The Analytics tab on your workspace's Embed page reports how your users use the embedded editor. This page lists everything it shows and what each number counts.
For the steps to open it, filter it and keep test accounts out, see the help article How to see how your users use the embed.
Availability#
| Plan | Analytics tab |
|---|---|
| Grow, Scale, Enterprise | Included |
| Other plans | Shows an upgrade card. Activity is still recorded, so the numbers are there after an upgrade. |
Periods#
Every number in the Activity section follows the selected period: Today, Yesterday, Last 7 days, This month or Last month. Days follow your workspace's time zone.
Summary cards#
| Card | What it counts |
|---|---|
| Embed users | People who used the embed in the period. People who were only turned away by the user limit are not counted. |
| Sessions | Times the editor was opened. |
| Time in editor | Time the editor was open and in view, with the average per session. |
| Templates created | New templates made in the embed. |
| Downloads | Designs exported from the embed in any format. Copying to the clipboard counts as a download. |
| API renders | Renders made through the API from templates used in the embed. |
Per day#
A daily chart for the period. It can show sessions, embed users, templates created or downloads.
From opening to output#
Four steps, each with the number of people who reached it:
| Step | Who is counted |
|---|---|
| Used the embed | Everyone who got into the editor. |
| Opened a template | People who opened at least one template. |
| Created or edited a template | People who created or saved a template. |
| Got an output | People who downloaded or rendered a design. |
Where it was used#
The sites your embed was loaded on, with sessions per site.
Embed users table#
One row per person in the period.
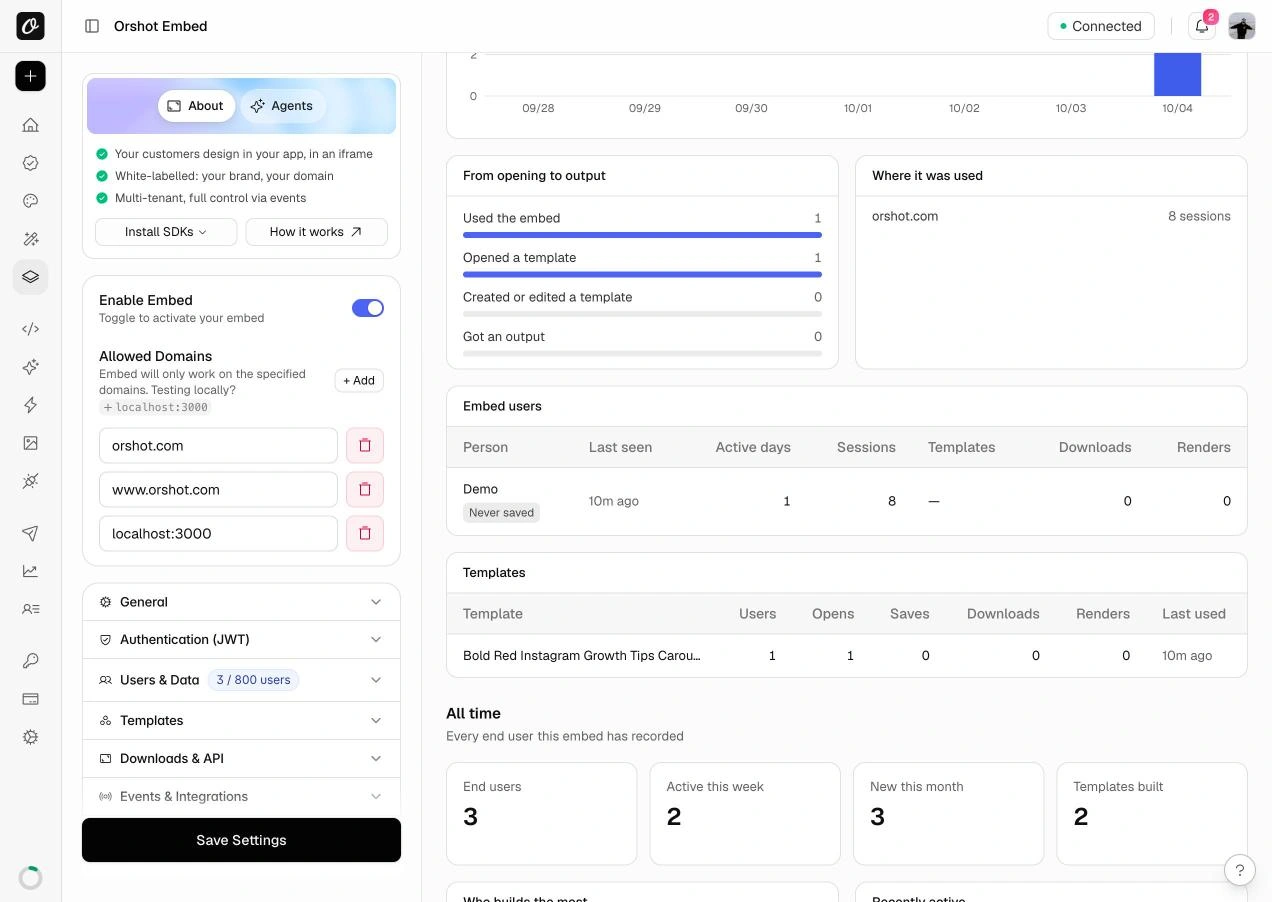
| Column | Meaning |
|---|---|
| Person | The name, email or userId you pass, or an anonymous visitor label. |
| Last seen | When they last used the embed. |
| Active days | Days in the period with activity. |
| Sessions | Times they opened the editor. |
| Templates | Templates they created and edited, for example "2 created · 1 edited". |
| Downloads | Designs they exported. |
| Renders | API renders of the templates they own or last edited. |
Labels#
| Label | Meaning |
|---|---|
| New | First used the embed in the selected period. |
| Quiet 14d+ | Has not used the embed for 14 days or more. |
| Never saved | Did not create or save a template in the selected period. |
| Blocked by limit | Was turned away by your plan's embed user limit. |
| Tracking only | Recorded for analytics while Per-User Data was off. Not counted toward your user limit. |
| Test user | Marked by you as a test account. Left out unless test traffic is included. |
| Approximate | An anonymous visitor. Counts for them are approximate. |
Grouping by metadata#
If you pass metadata in the embed URL, the table can be grouped by one of its fields, such as plan or company. Each group shows users, sessions, templates, downloads and renders.
Templates table#
One row per template used in the period.
| Column | Meaning |
|---|---|
| Template | The template's name. A template an embed user copied from another one shows "Based on" with the original's name. |
| Users | People who used it in the period. |
| Opens | Times it was opened. |
| Saves | Times it was saved. |
| Copies | Copies your embed users made of it, all time. Hover to see how many users made them. |
| Downloads | Designs exported from it. |
| Renders | API renders of it. |
| Last used | The most recent activity on it. |
A copy is recorded when a user opens one of your workspace templates with Prevent Workspace Template Overriding on and saves it, or uses Duplicate. Copies made before October 4, 2026 by opening a protected template have no "Based on" line.
The same "Based on" line appears on each template in a person's Templates tab under Your Users.
All time#
Totals that ignore the selected period:
| Item | Meaning |
|---|---|
| End users | Every user this embed has recorded. |
| Active this week | Users active in the last 7 days. |
| New this month | Users first seen in the last 30 days. |
| Templates built | Templates created by your embed users. |
| Who builds the most | Users ranked by templates. |
| Recently active | Users by last activity. |
One person's activity#
Each person in the Your Users tab has an Activity tab covering their last 30 days:
- Active days, sessions and active time.
- A bar per day with sessions, saves and downloads.
- A timeline of what they did: opened the editor, opened, created, saved, renamed, duplicated or deleted a template, or was blocked by the user limit.
The Your Users list also shows each person's sessions, templates and last activity.
How people are identified#
| You pass | How they appear | Accuracy |
|---|---|---|
A userId | Under the name, email or ID you pass. See Per-User Data. | Exact per person. |
No userId | As an anonymous visitor, for example "Visitor 4F2A". | Approximate. The same person on another browser or device shows up as a new visitor. |
A userId is recorded even when Per-User Data & Templates is off. The
person is shown with a Tracking only label and does not count toward
your plan's embed user limit.
What is recorded#
Orshot records a row when the embed loads and when a user does something in it: opens, creates, saves, renames, duplicates or deletes a template, downloads a design, or uploads an asset. Time in the editor is measured while the tab is in view.
The contents of a design are not part of these records. Deleting an embed user also deletes their activity.
Monthly recap email#
Your monthly usage recap email includes an embed section next to your API usage: how many people used the embed that month, their sessions and active time, what they made, their downloads, and anyone turned away by the user limit.
Your own analytics#
These numbers stay in your Orshot dashboard. To send embed activity to your own analytics tool, listen for Events on your page or receive Webhooks on your server.
Ready to automate?
Start rendering images, PDFs and videos from your templates in under 2 minutes. Free plan, no credit card.
Get your API key- Image, PDF and video generation via API
- Visual editor with AI and smart layouts
- Zapier, Make, MCP and 50+ integrations
- White-label embed for your own app
- 100 free credits a month, no credit card required