← All Templates
Infographic Stat Card with Donut Chart
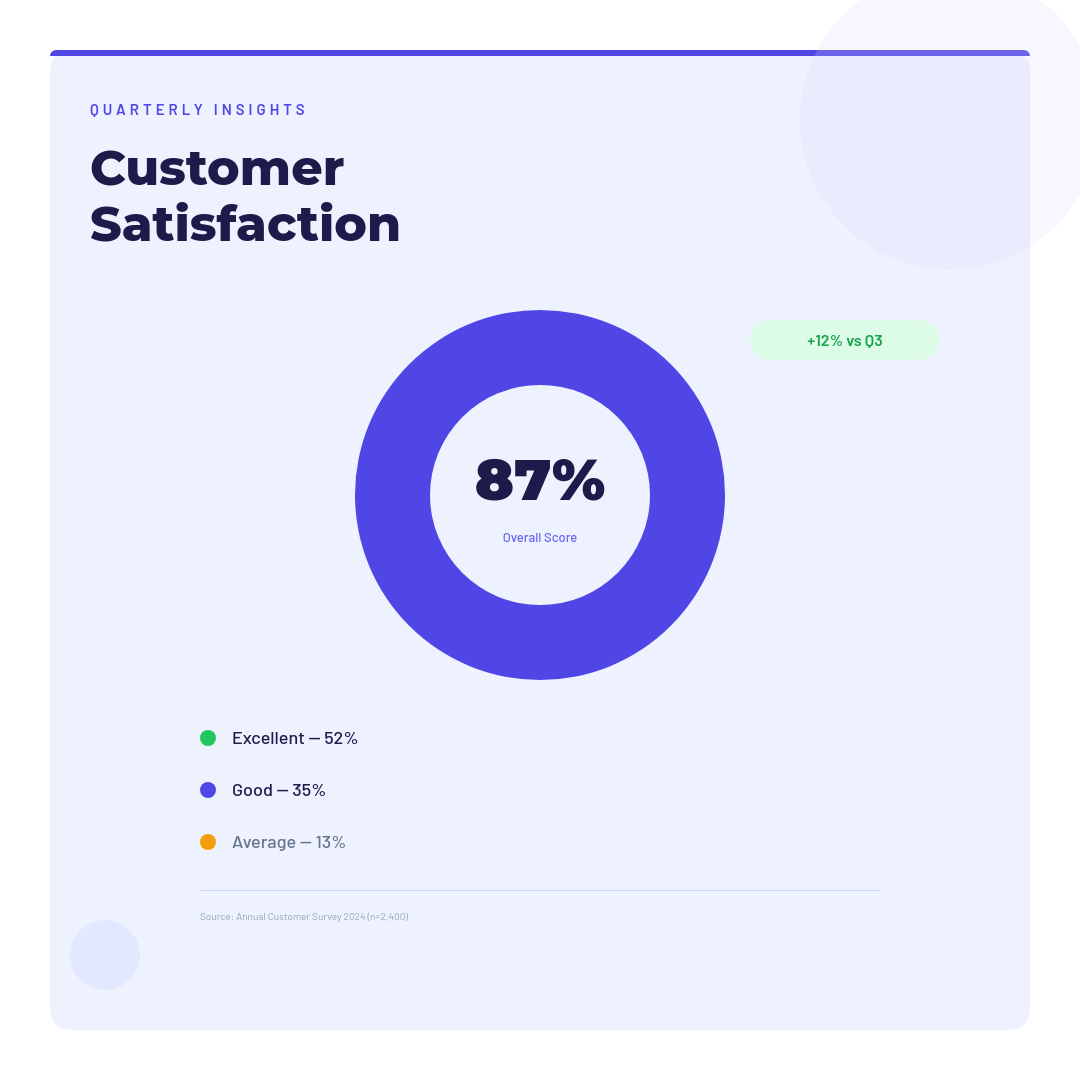
Instagram infographic post with donut chart, color-coded stat rows, and clean data layout — ideal for quarterly reports, KPIs, and business metrics.
Template Info
| Type | Dimensions | Supported Templates | Supported Types |
|---|---|---|---|
| Studio Template | 1200x630 | png jpg webp pdf | base64 url binary |
Integrations
Automate this template using integrations
Backend Usage
You can generate Infographic Stat Card with Donut Chart renders using Rest API
await fetch("https://api.orshot.com/v1/studio/render", {
  method: "POST",
  headers: {
    "Content-Type": "application/json",
    Authorization: "Bearer <ORSHOT_API_KEY>",
  },
  body: JSON.stringify({
    "templateId": 471,
    "response": {
      "format": "png",
      "type": "base64"
      "scale": 1
    },
    "modifications": {
      "<YOUR_DYNAMIC_PARAMETERS>"
    }
  }),
});