Social Media Analytics with API & AI Agents
One social media analytics dashboard for all your accounts: impressions, engagement, clicks, and follower growth, with an API your agents can use.
$12/mo per connected account · analytics included · data from day one
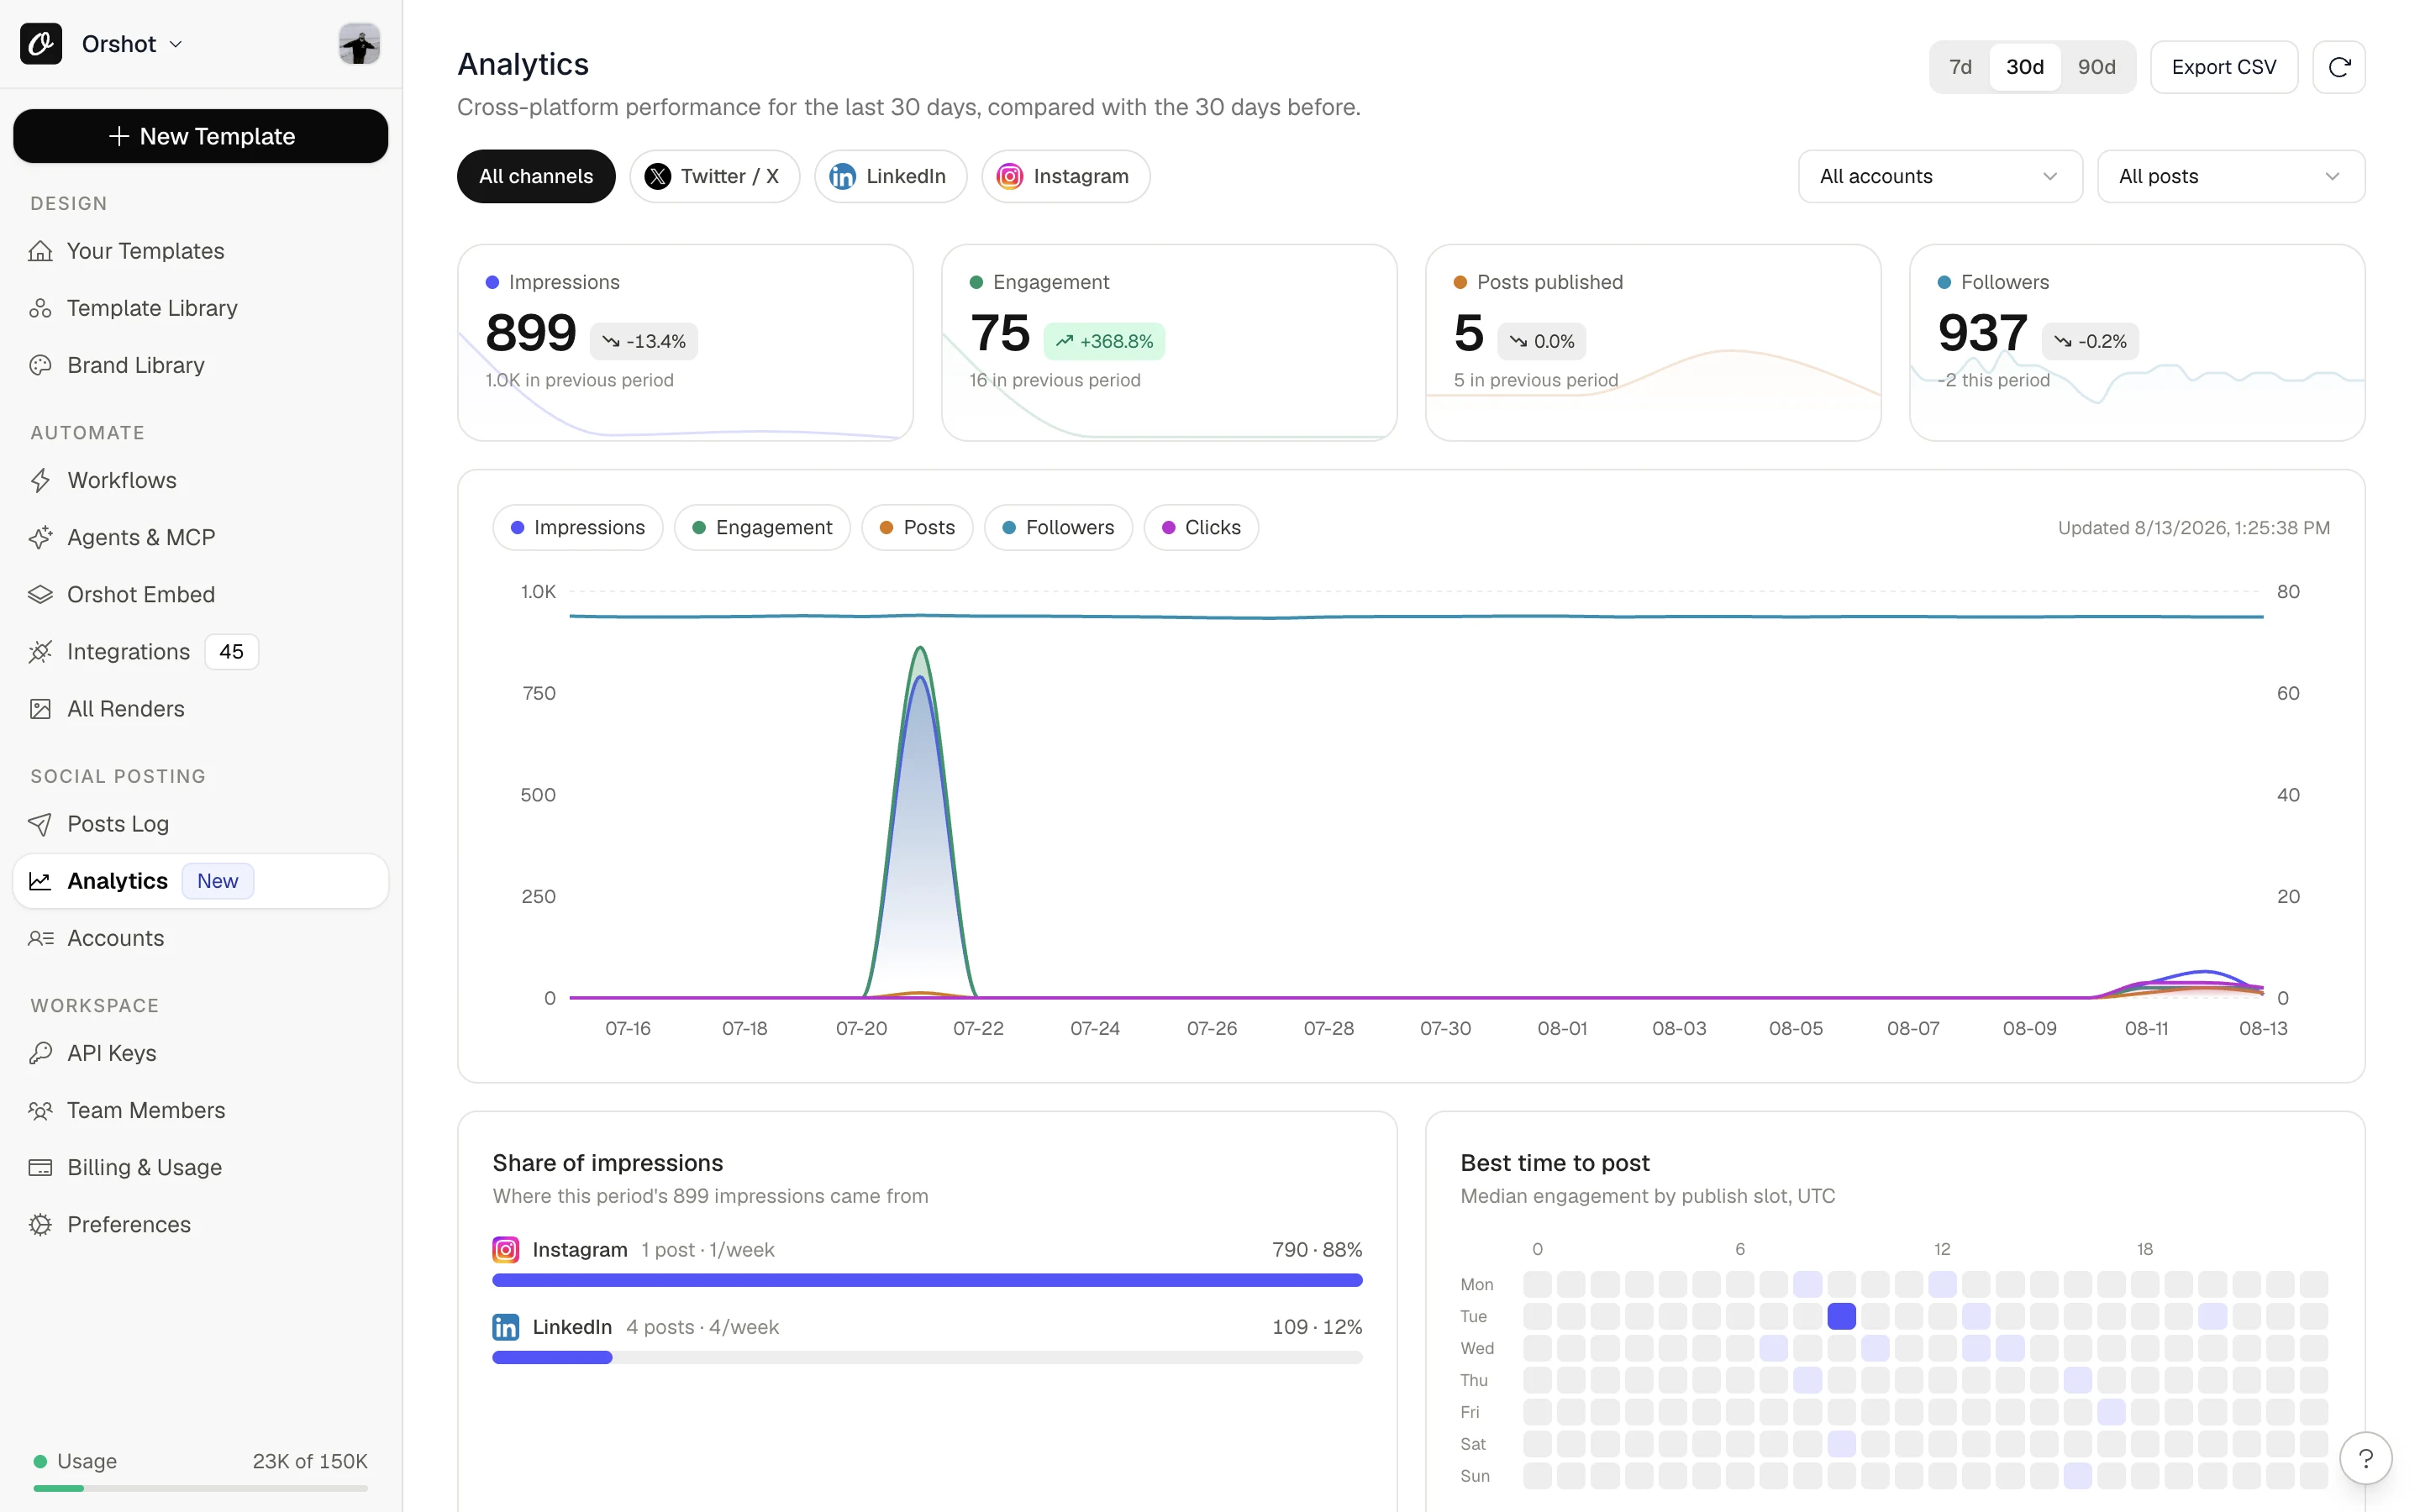
See every account at once
LinkedIn, X, Instagram and the rest on one chart, compared with the previous period. No more tab-hopping between native analytics.
Find your winners
Posts ranked by what actually earned engagement. Repost the angle that worked, not the one you liked.
Post when your audience is around
The best-time heatmap comes from your own engagement history, not a blog post from 2019.
Back the right account
Which account earns the most per post? The side-by-side table tells you where the effort pays off.
Numbers with your coffee
Yesterday's impressions, follower changes and top post, mailed to you every morning. Toggle it anytime.
Every post, receipts attached
Likes, comments, shares, saves, clicks, reach and engagement rate on each post, day by day.
Double down on what already works.
The whole dashboard is built around one question: what should you post next? Ranked top posts, your peak posting window, and follower trends turn last week's results into next week's plan.
- Top posts ranked by engagement, impressions, likes or clicks
- Best time to post, learned from your own audience
- Follower growth for every connected account on one chart
- Search and sort the performance of everything you've published
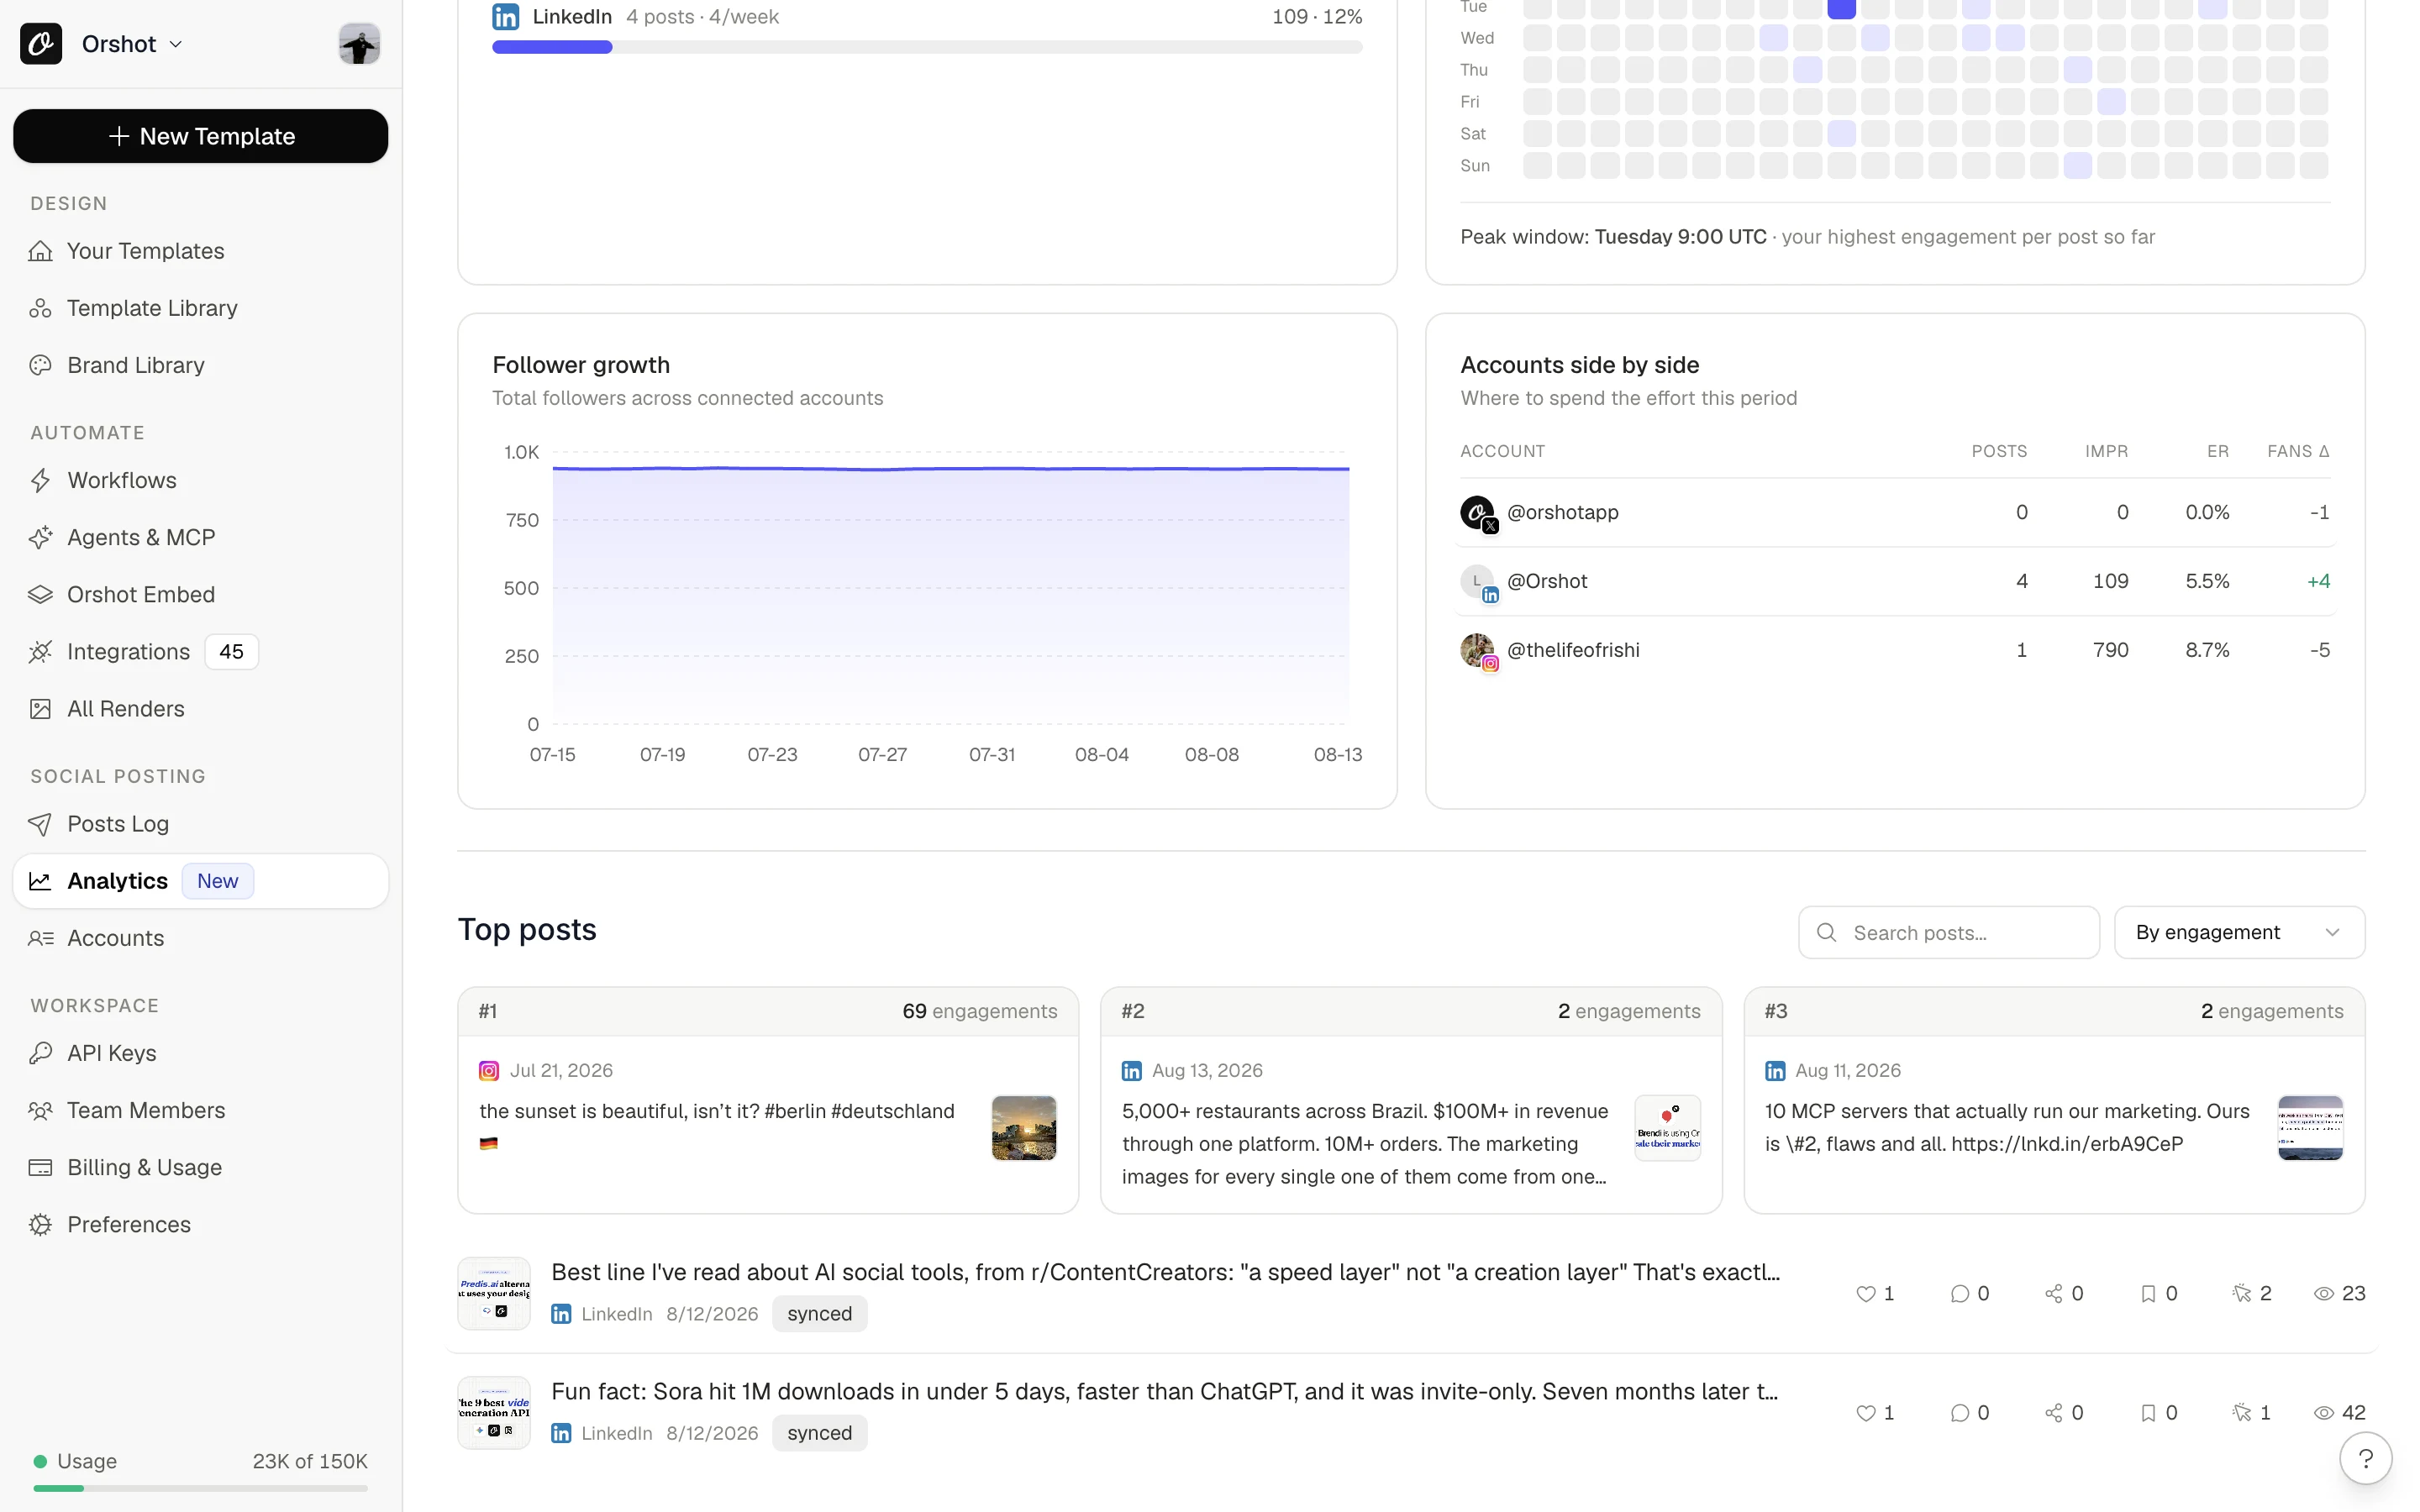
Your numbers live where you post.
No separate reporting tool. Every post in the Posts Log carries its metrics, and one click opens the full story: reach, saves, clicks, engagement rate, and daily charts.
- Performance on every row of the Posts Log
- The full per-post breakdown, one click away
- Posts synced from your platforms count too, so nothing starts at zero
- CSV export for when someone asks for the report
Your agent reads the numbers and plans the week.
Under the dashboard sits a social media analytics API, the same one we use. Point Claude at it through Orshot for agents and the loop closes itself: render, publish, measure, repeat. It's exactly how we run our own LinkedIn and X.
- Ask in plain language: top posts, follower change, best posting window, per-platform numbers
- Agents plan content from real performance, not vibes
- Works with Claude, Cursor and any agent, on the same accounts and billing
Every number, one GET away.
Five documented endpoints cover the whole dashboard: cross-account analytics, daily series, computed insights, follower stats, and per-post breakdowns. Authenticate with your API key and build whatever the dashboard doesn't.
- Same API key as rendering and publishing
- Filter by platform, account, source and date range
- Cached responses with a refresh switch when you need live numbers
- 10 requests per minute, plenty for daily reporting jobs
https://api.orshot.com/v1/social/analytics?from=2026-08-01
Cross-platform metrics
Impressions, reach, likes, comments, shares, saves, clicks, views and engagement rate, comparable across platforms.
Best time to post
A day-by-hour heatmap of your engagement, with your peak window called out.
Follower history
Daily follower counts per account, with growth badges and sparklines.
Daily digest email
Yesterday's numbers and your top post, every morning. Quiet days send nothing.
CSV export
Take every post's metrics with you for client reports or a deeper dig.
Included with Social Posting
$12/mo per connected account on any paid plan. Analytics costs nothing extra.
Frequently asked questions
What is social media analytics?
What is a social media analytics API?
Can AI agents read the analytics?
How do I track social media analytics across platforms?
What metrics matter in social media analytics?
How do I automate social media analytics?
How do I find my best time to post?
How do I create a social media analytics report?
Do I need a separate social media analytics tool?
Stop posting into the void.
Connect an account and the dashboard fills from day one, existing posts included. $12/mo per account, analytics at no extra cost.