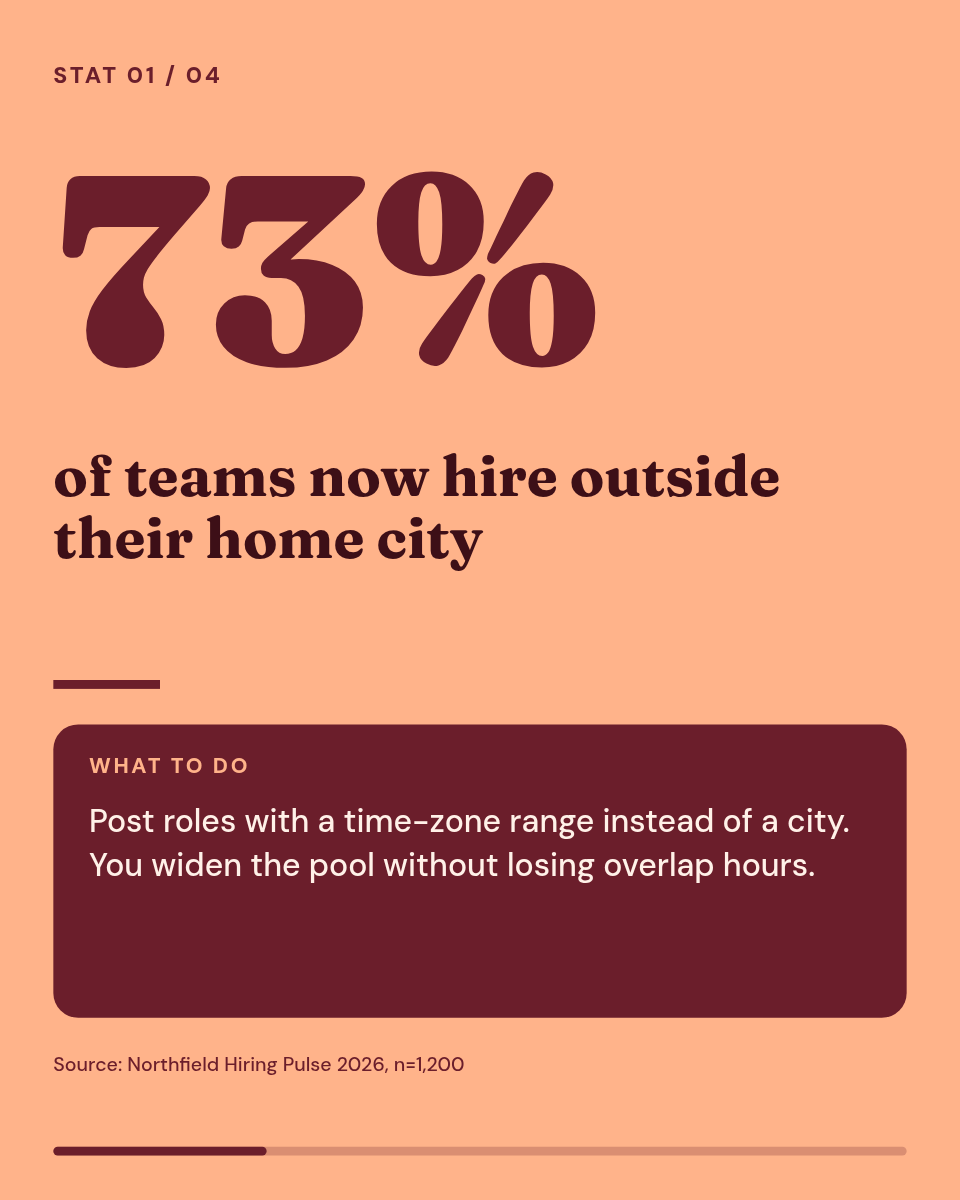
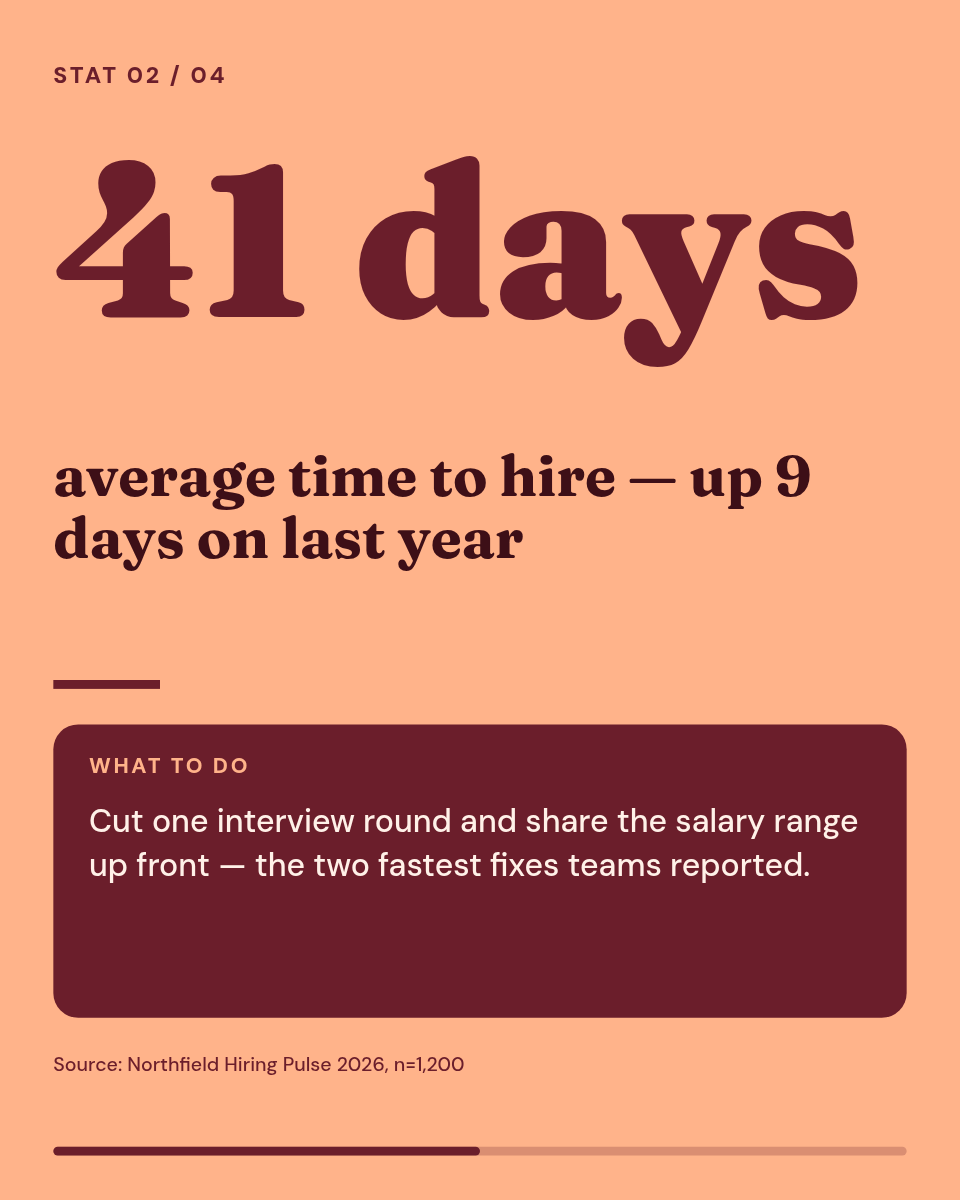
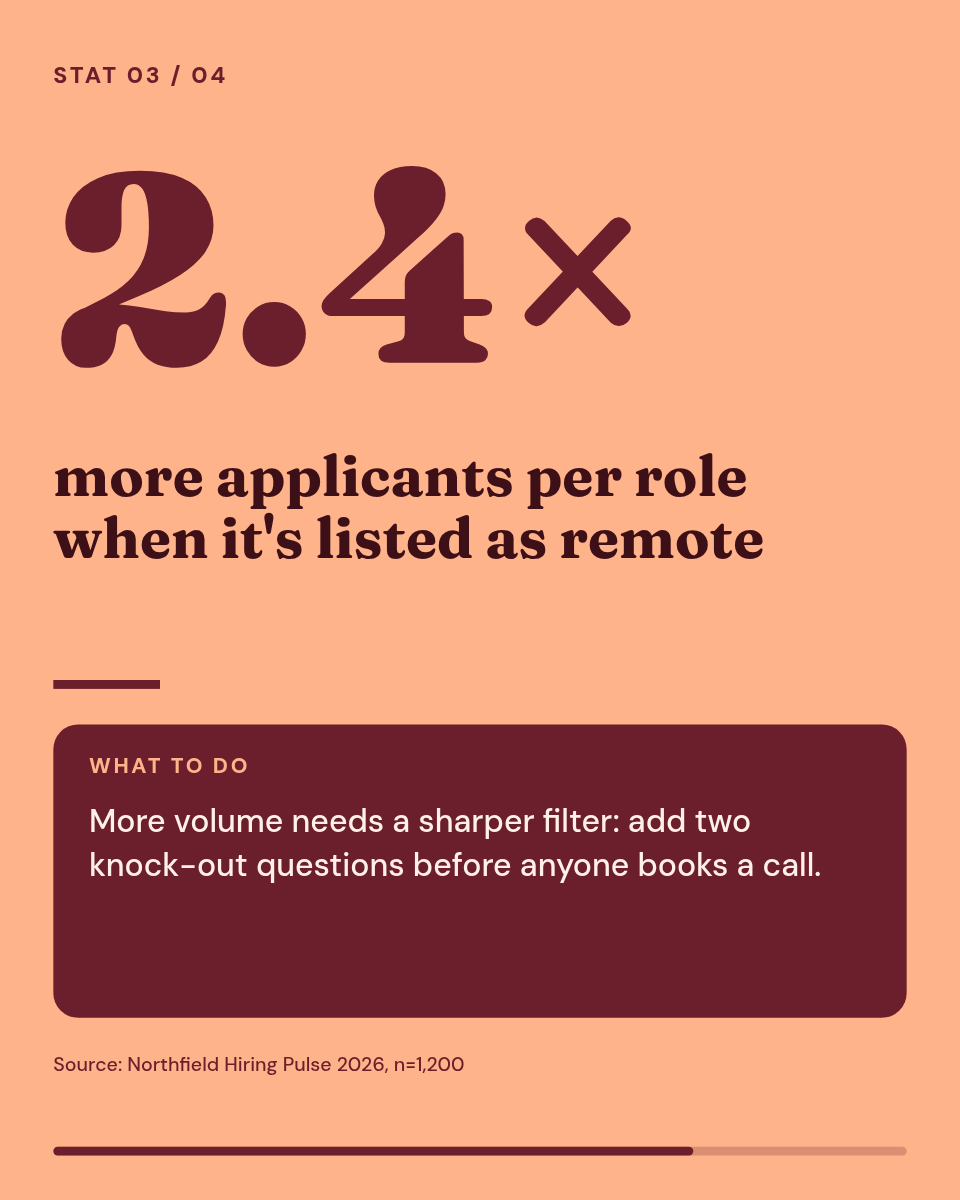
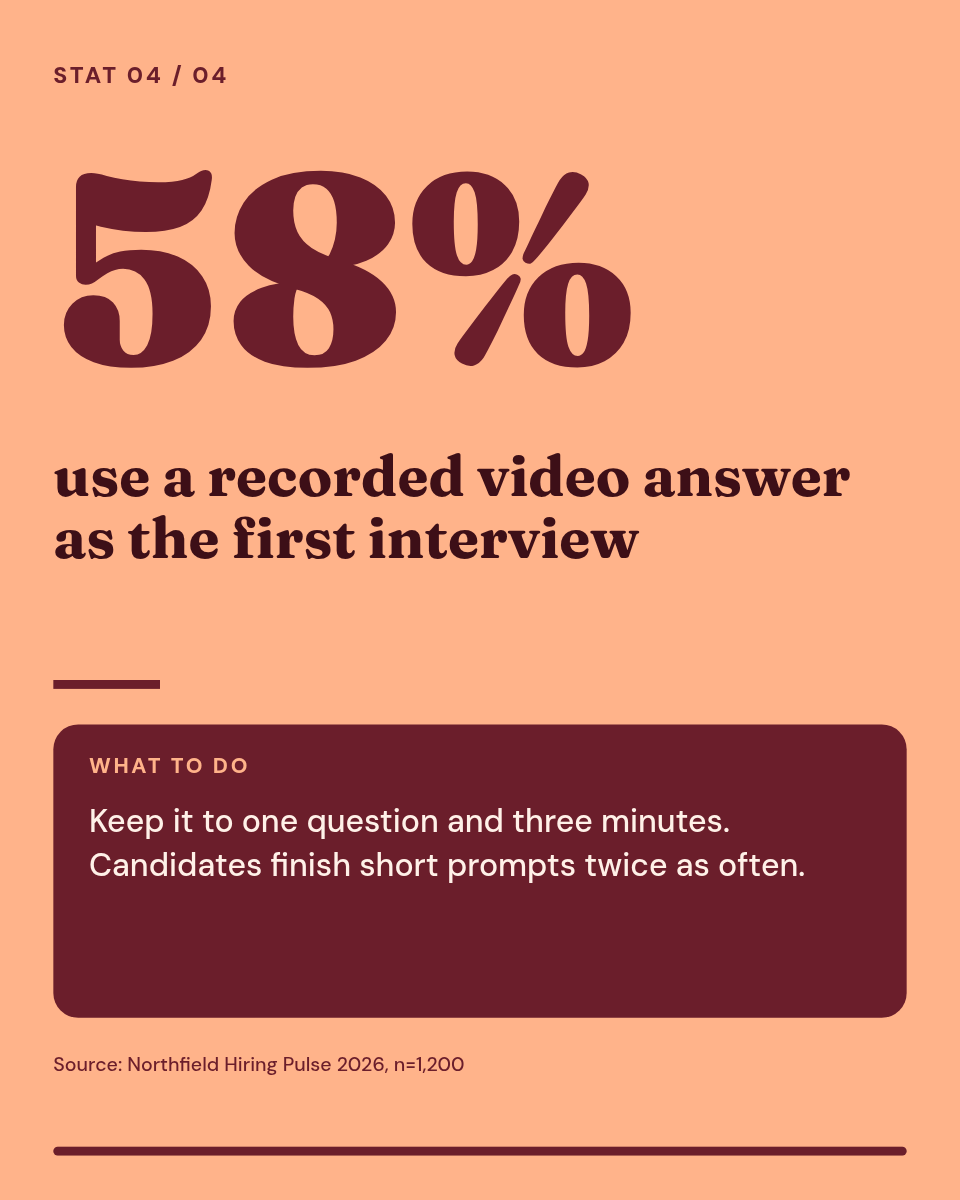
All Templates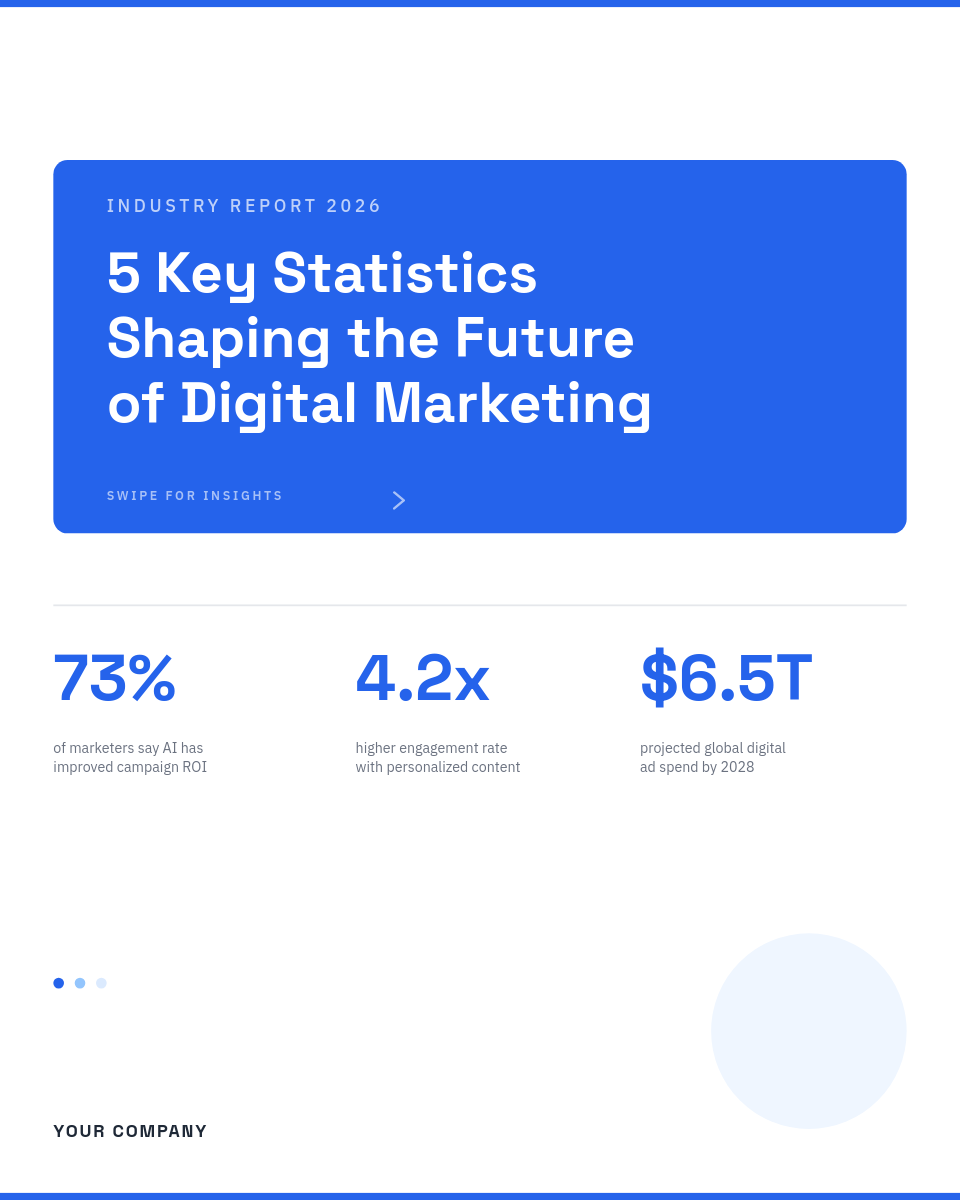
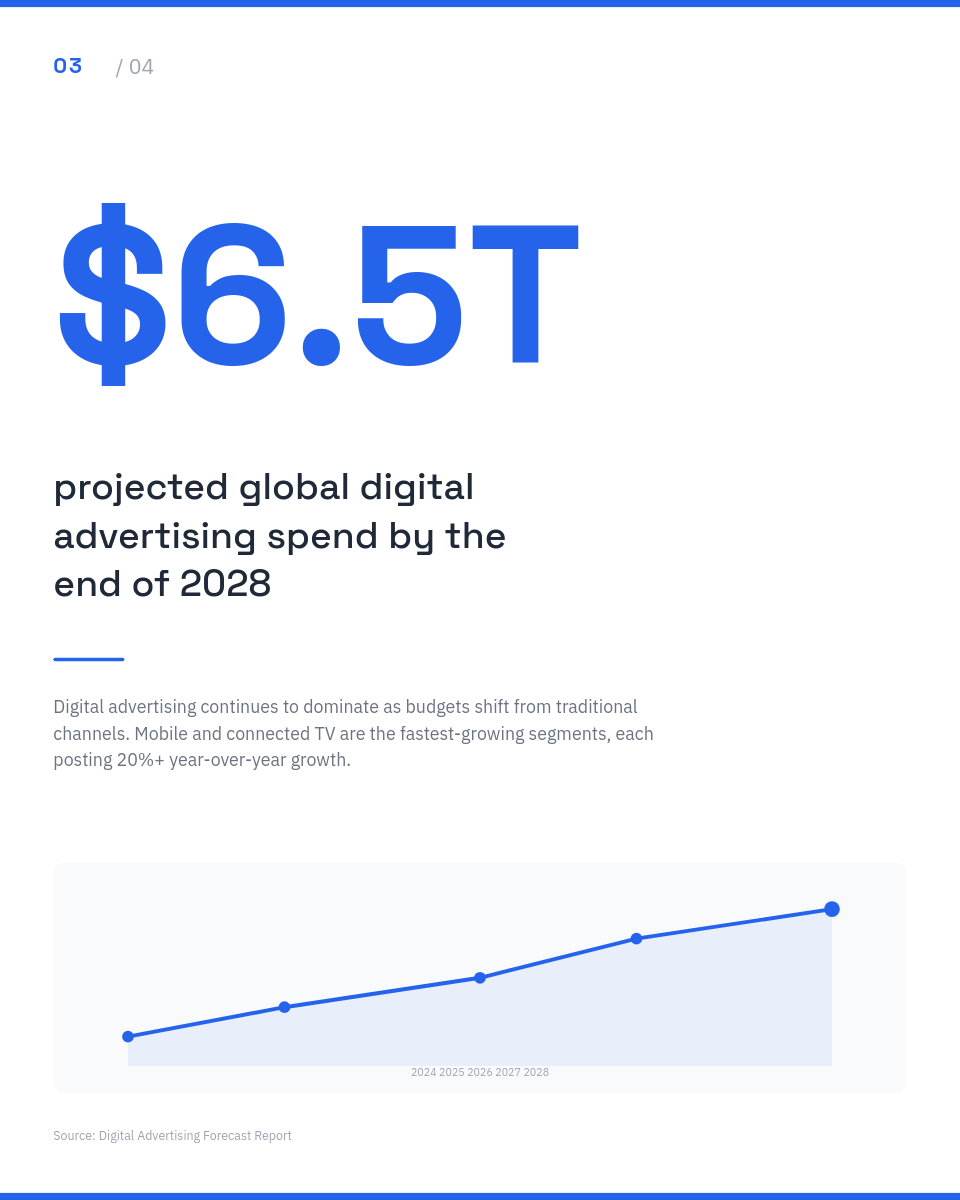
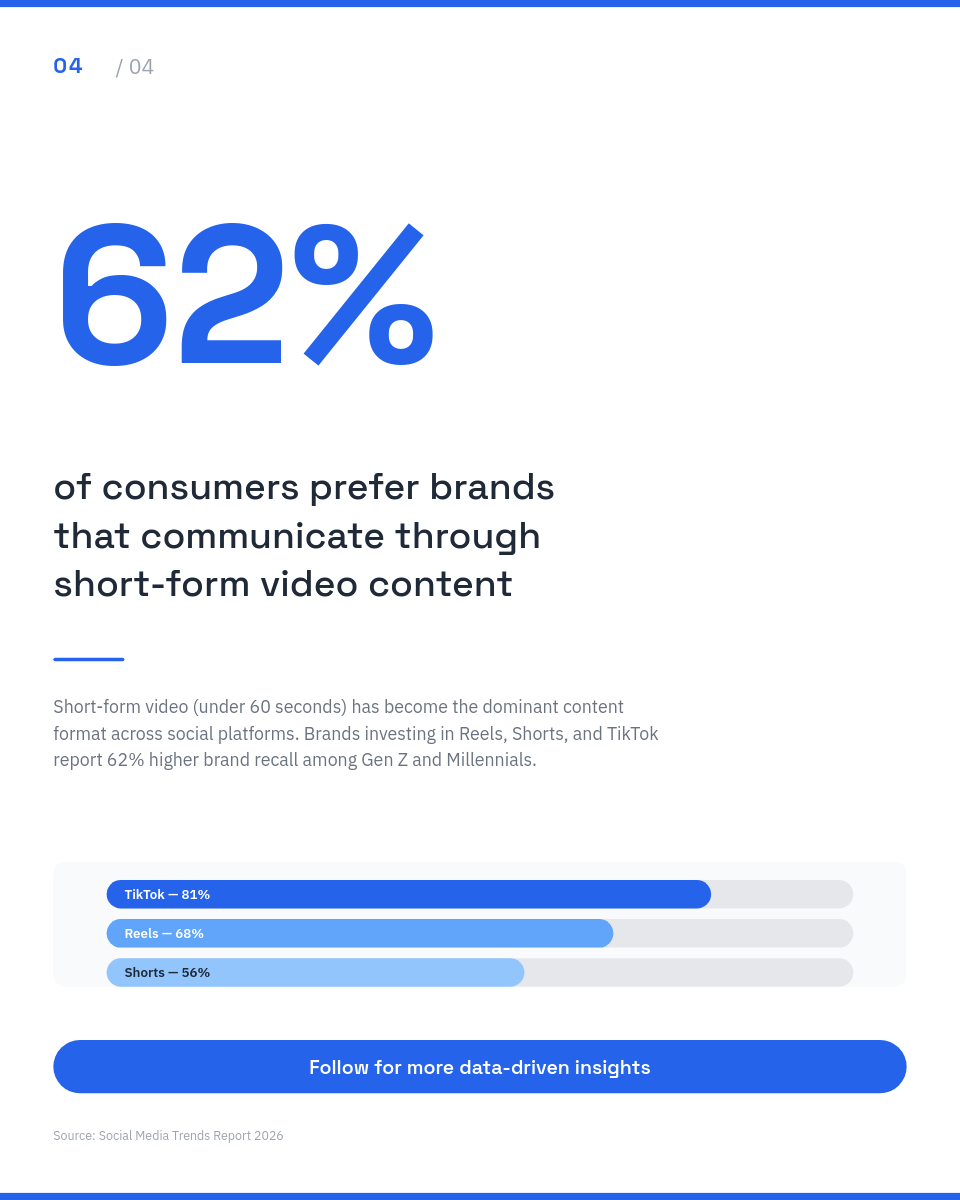
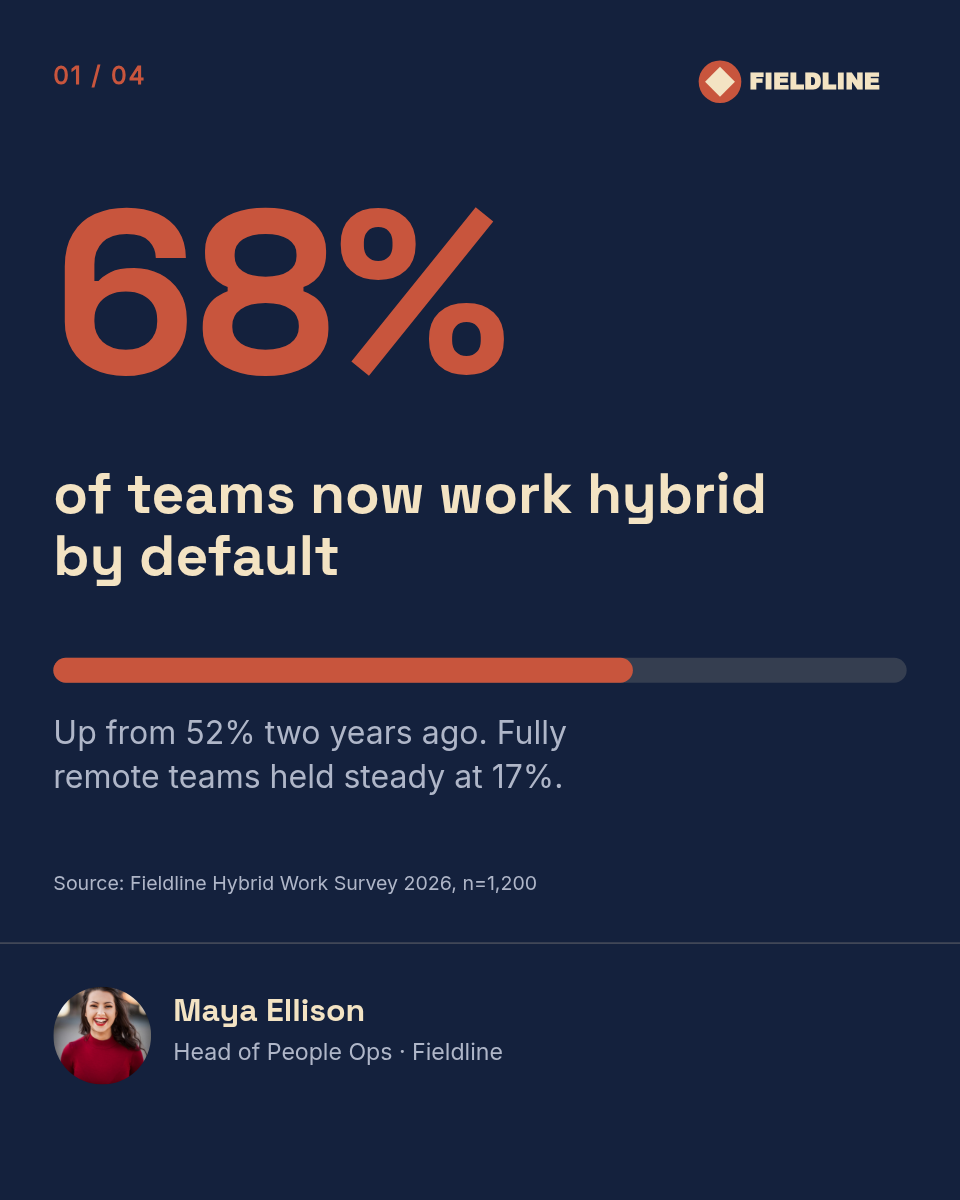
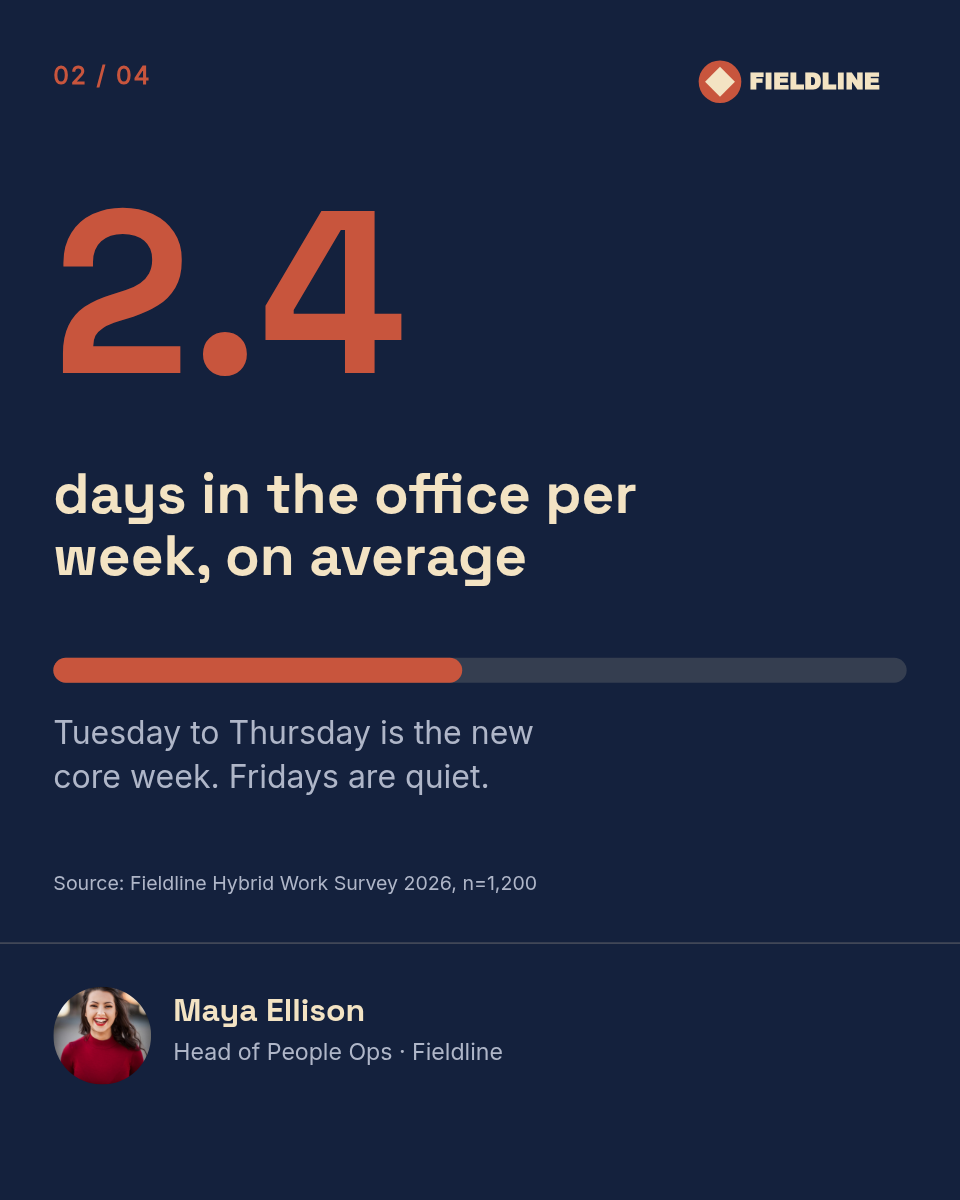
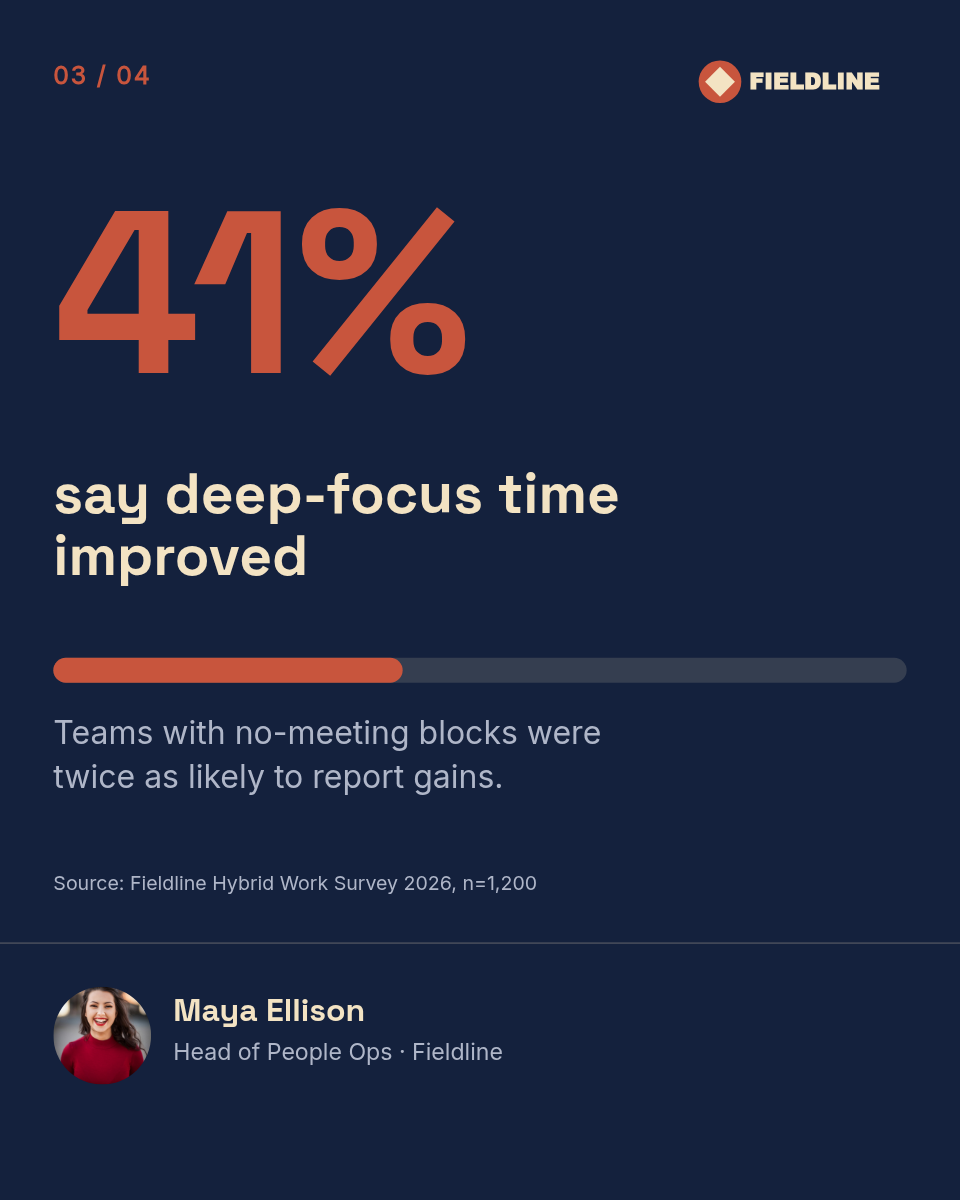
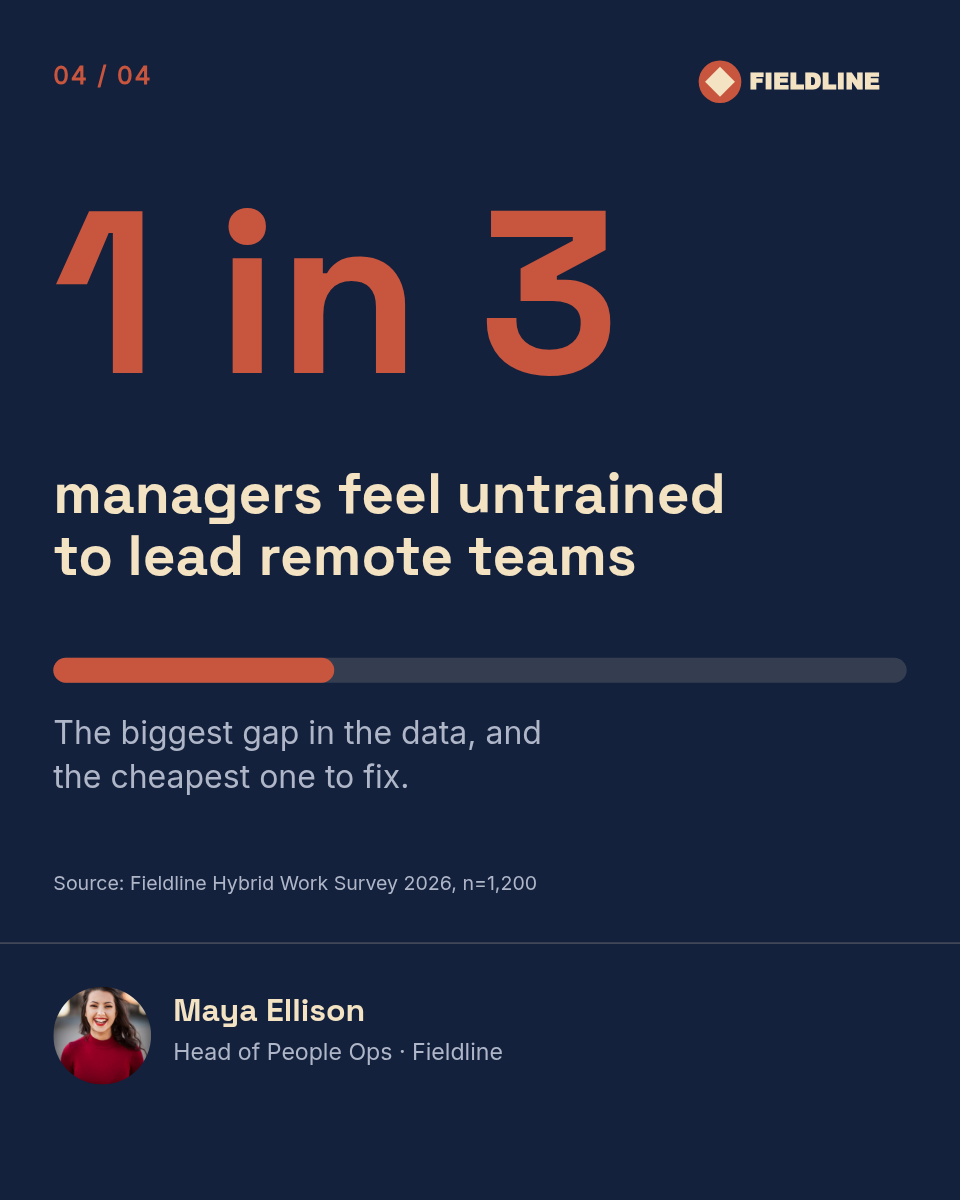
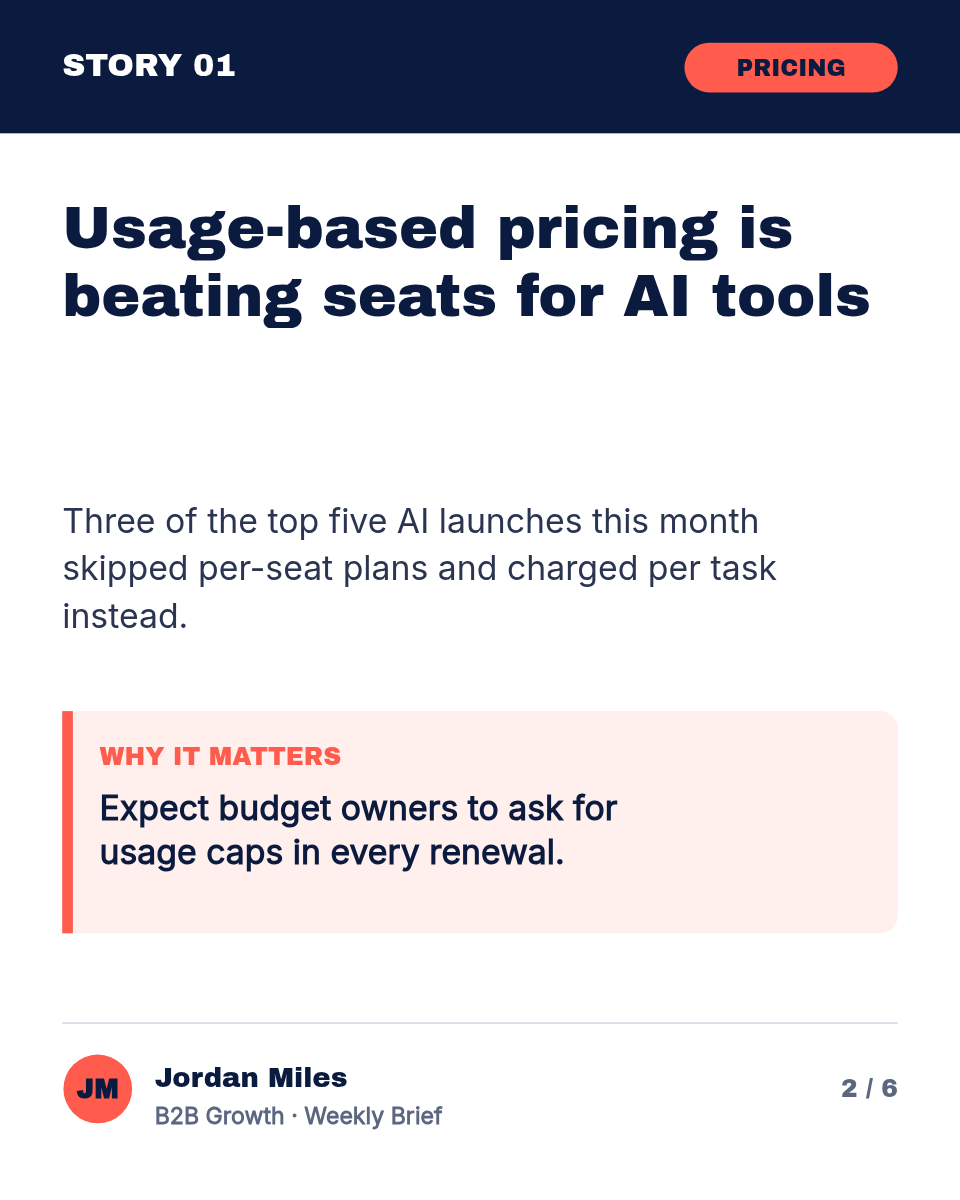
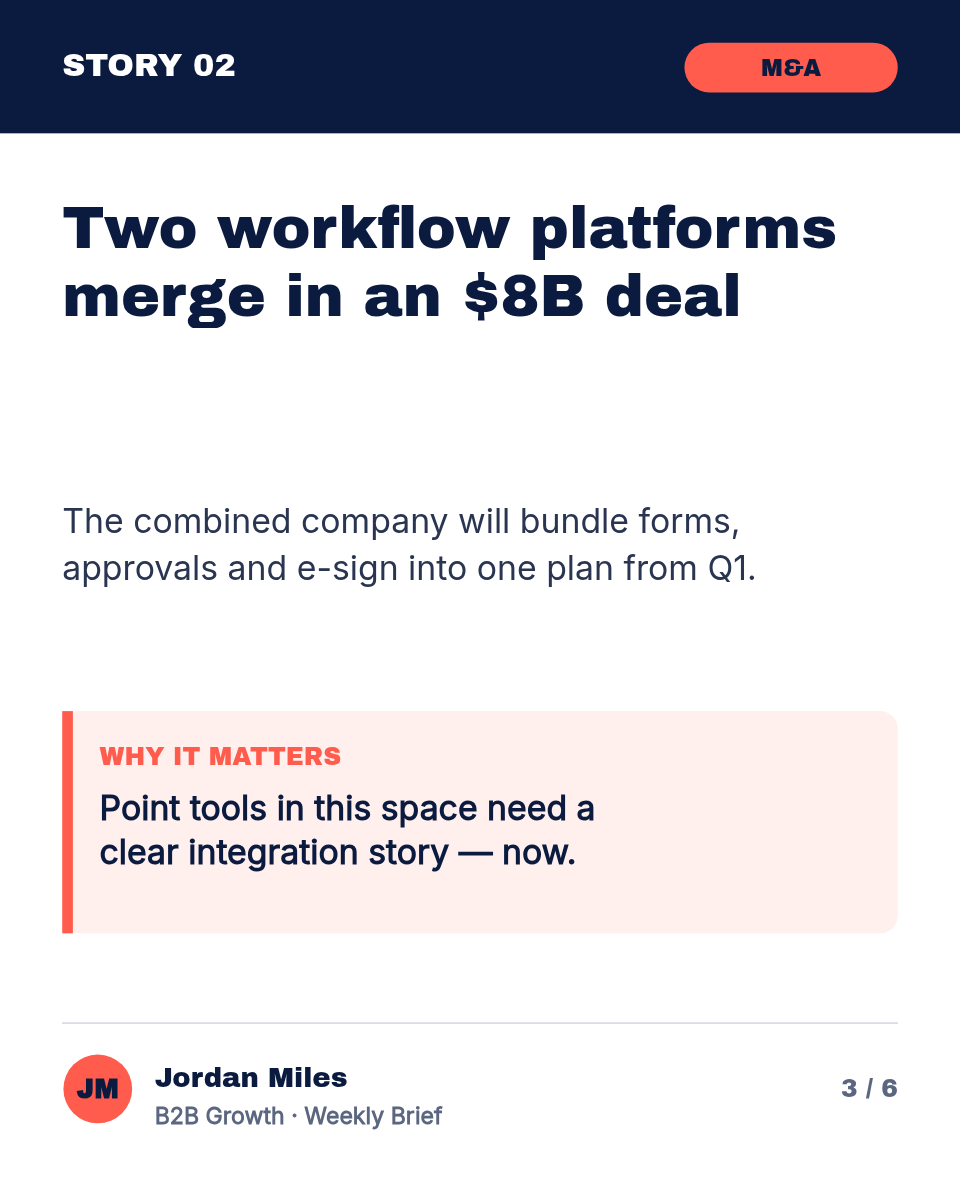
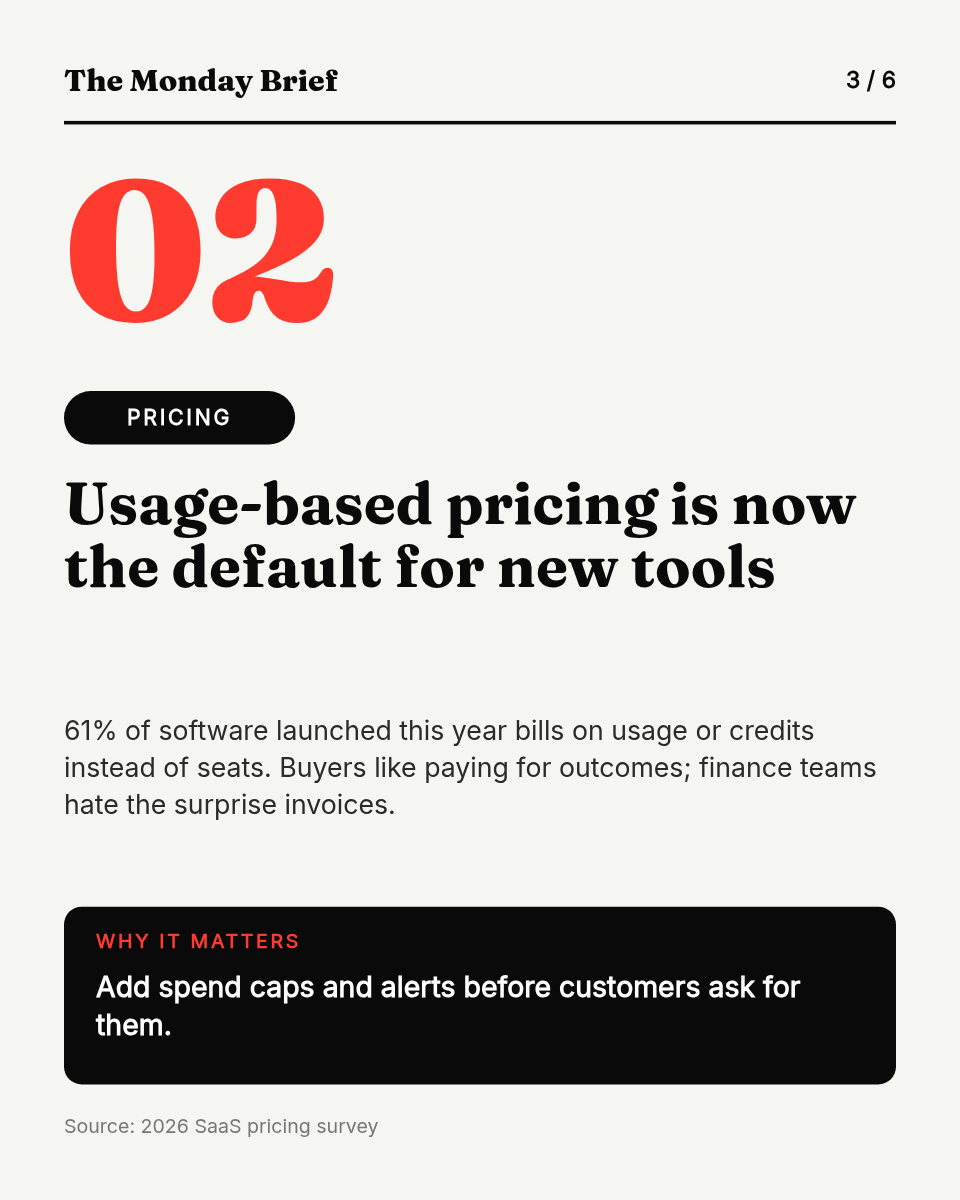
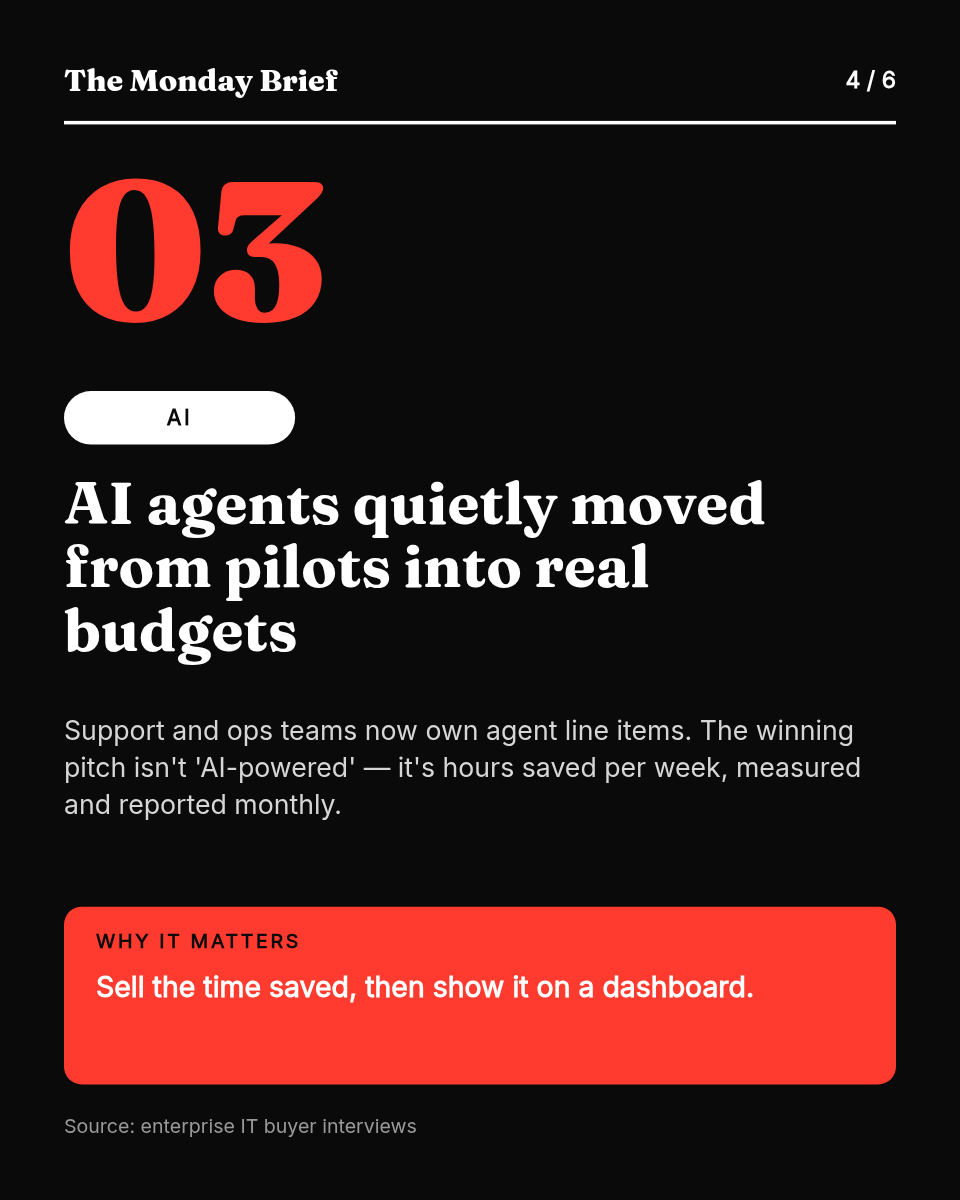
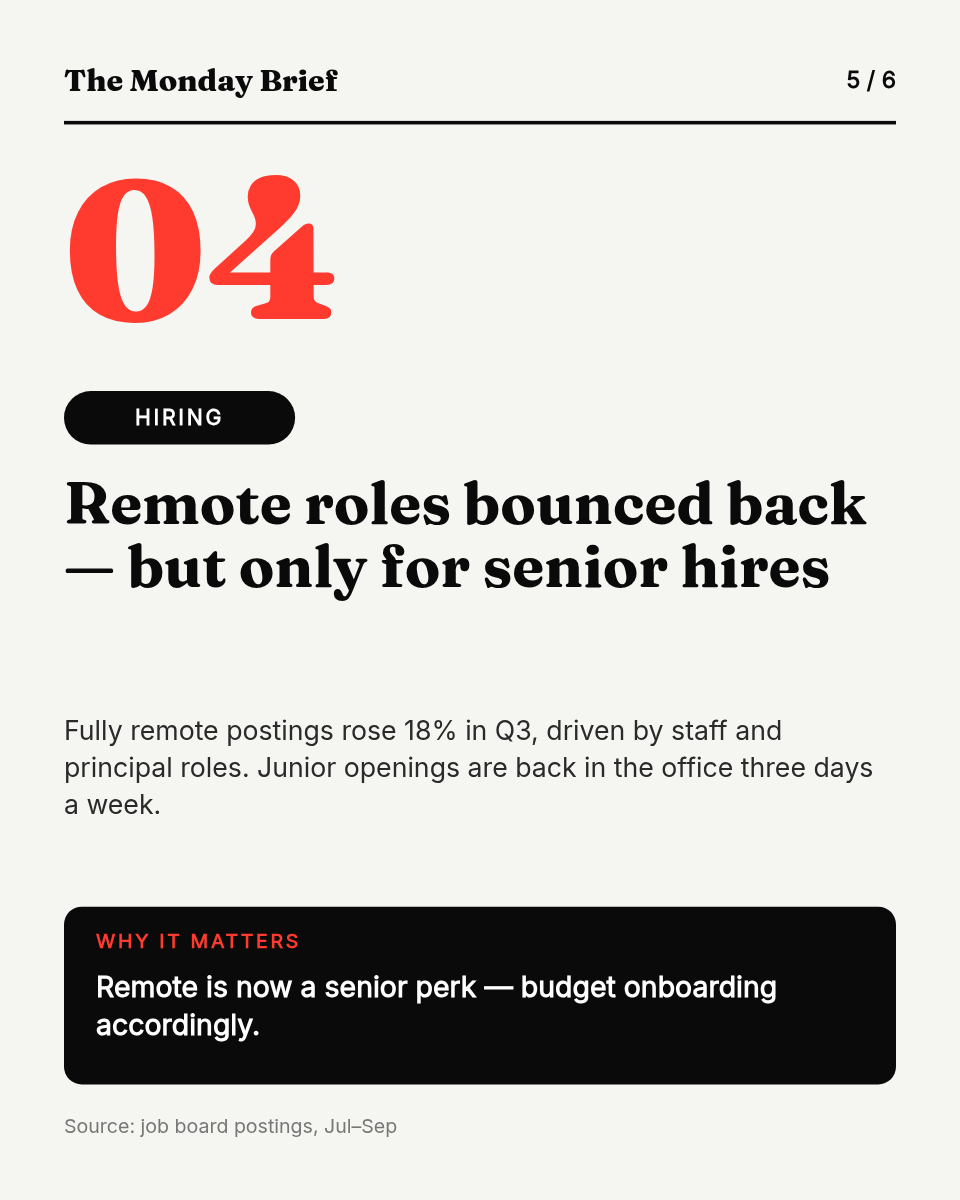
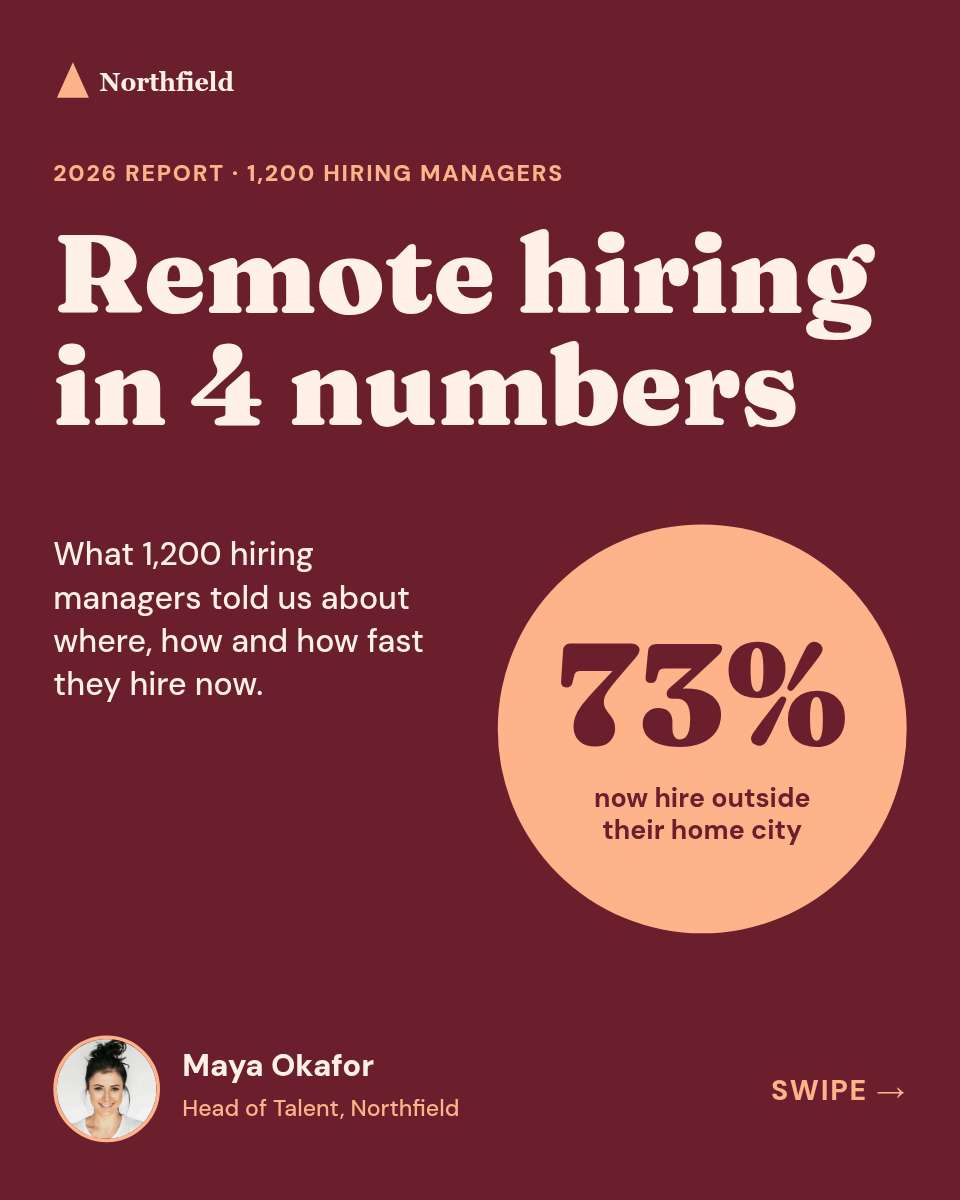
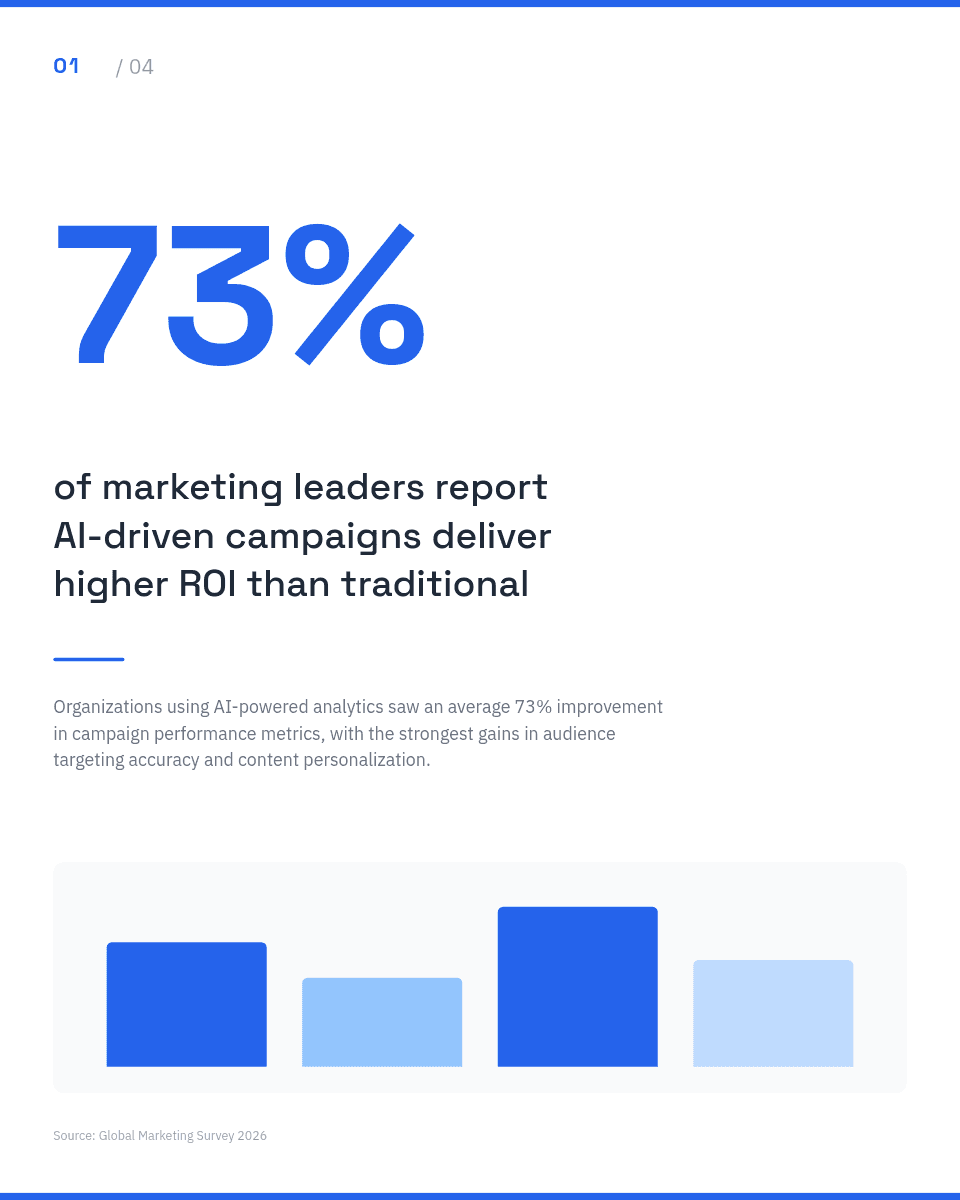
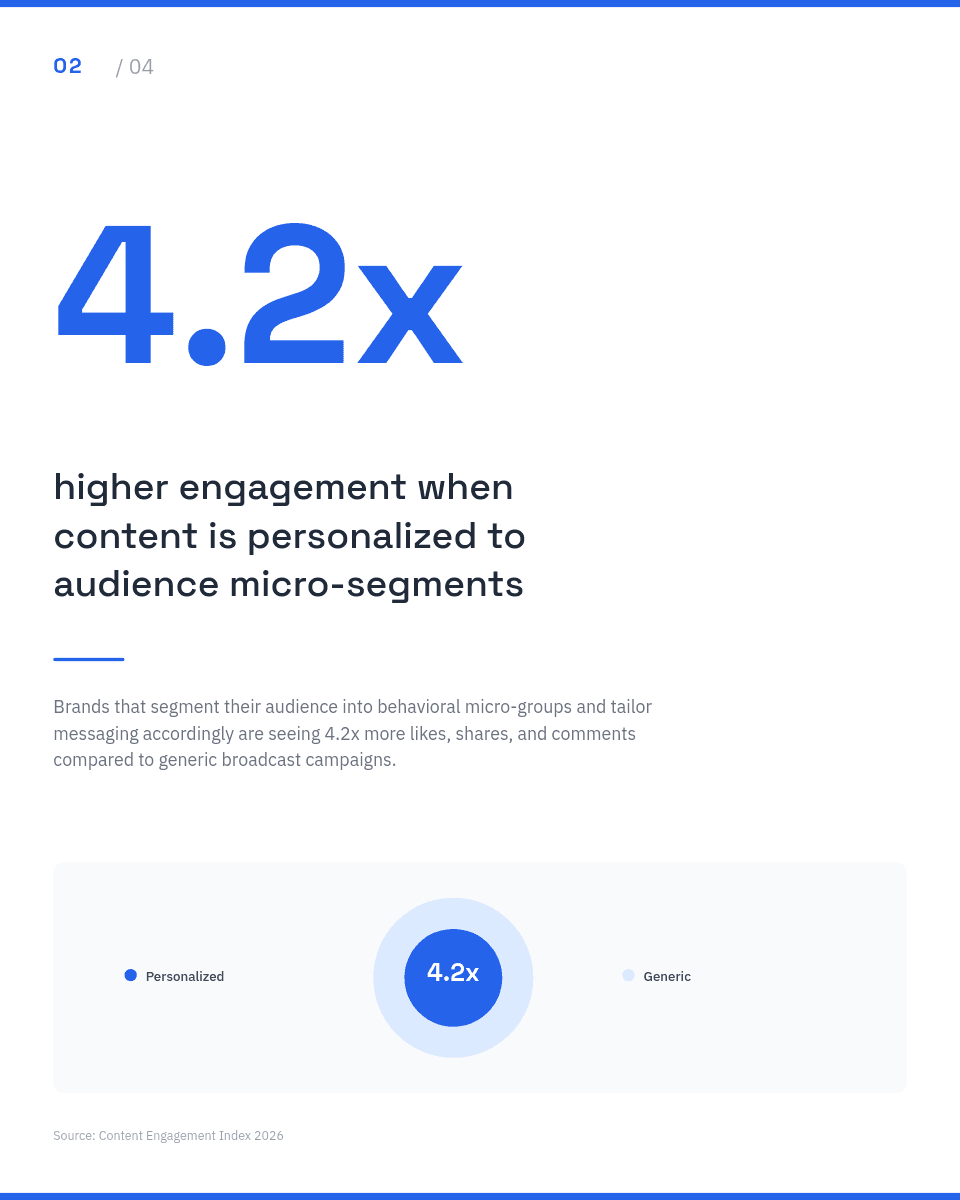
Clean Blue Industry Statistics Carousel with Large Numbers and Chart Accents
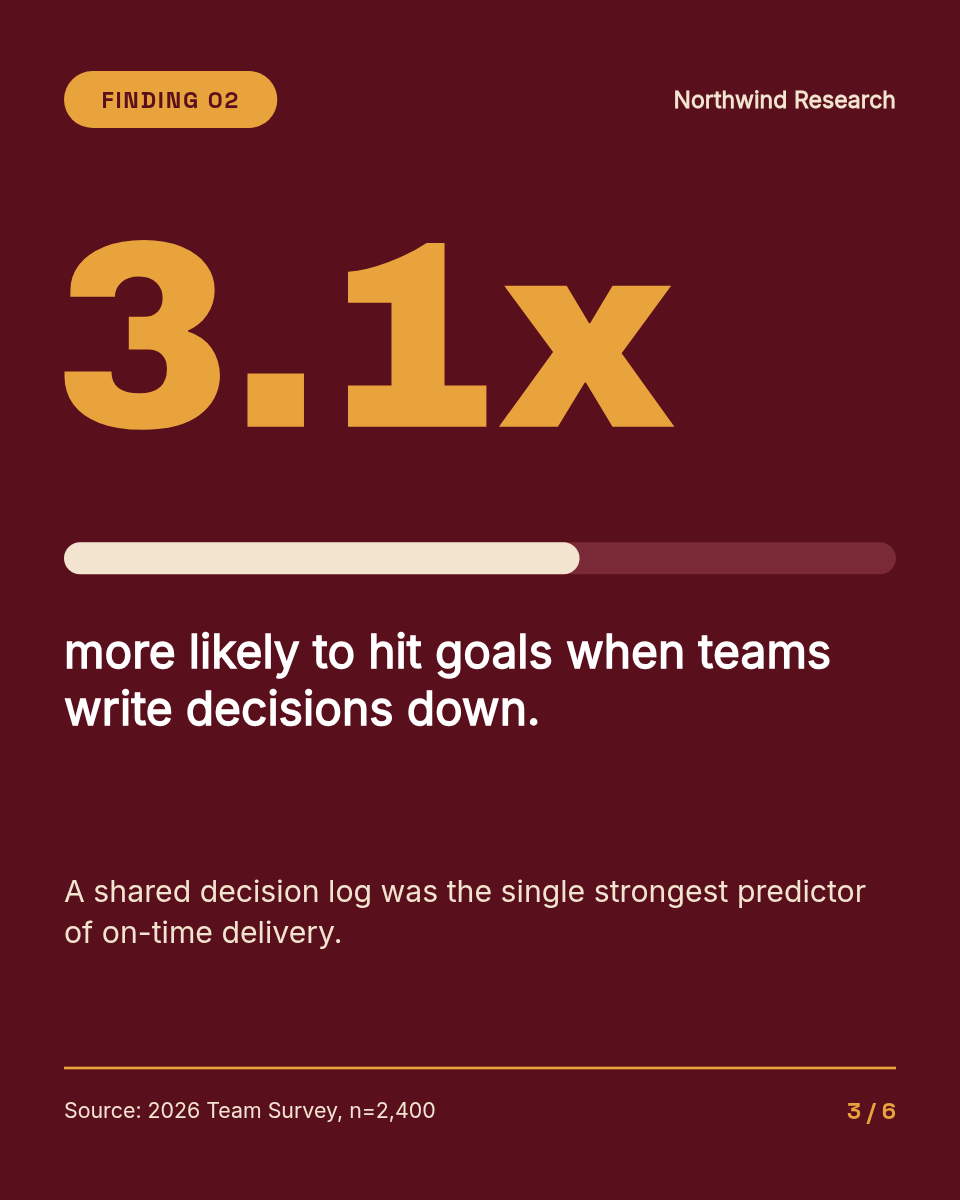
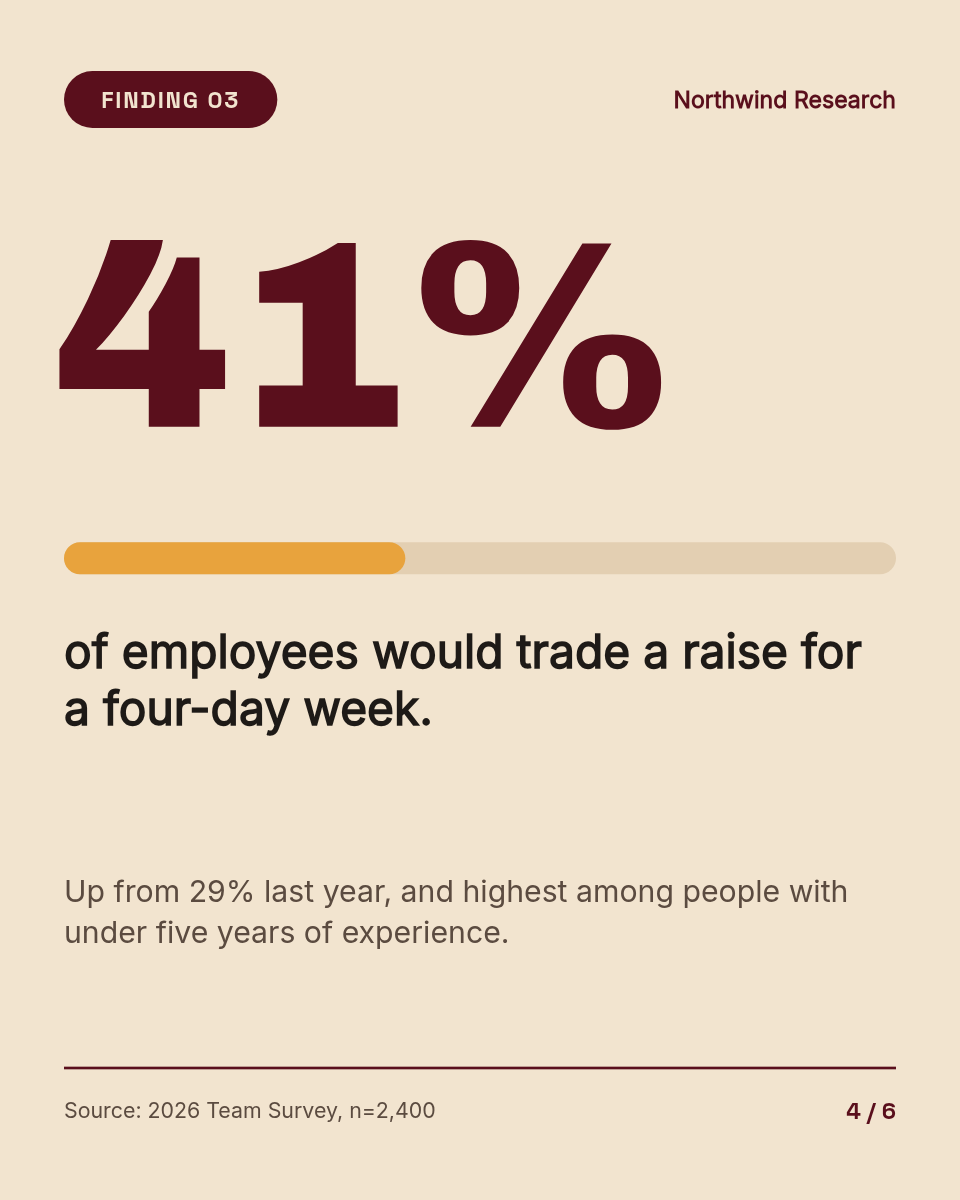
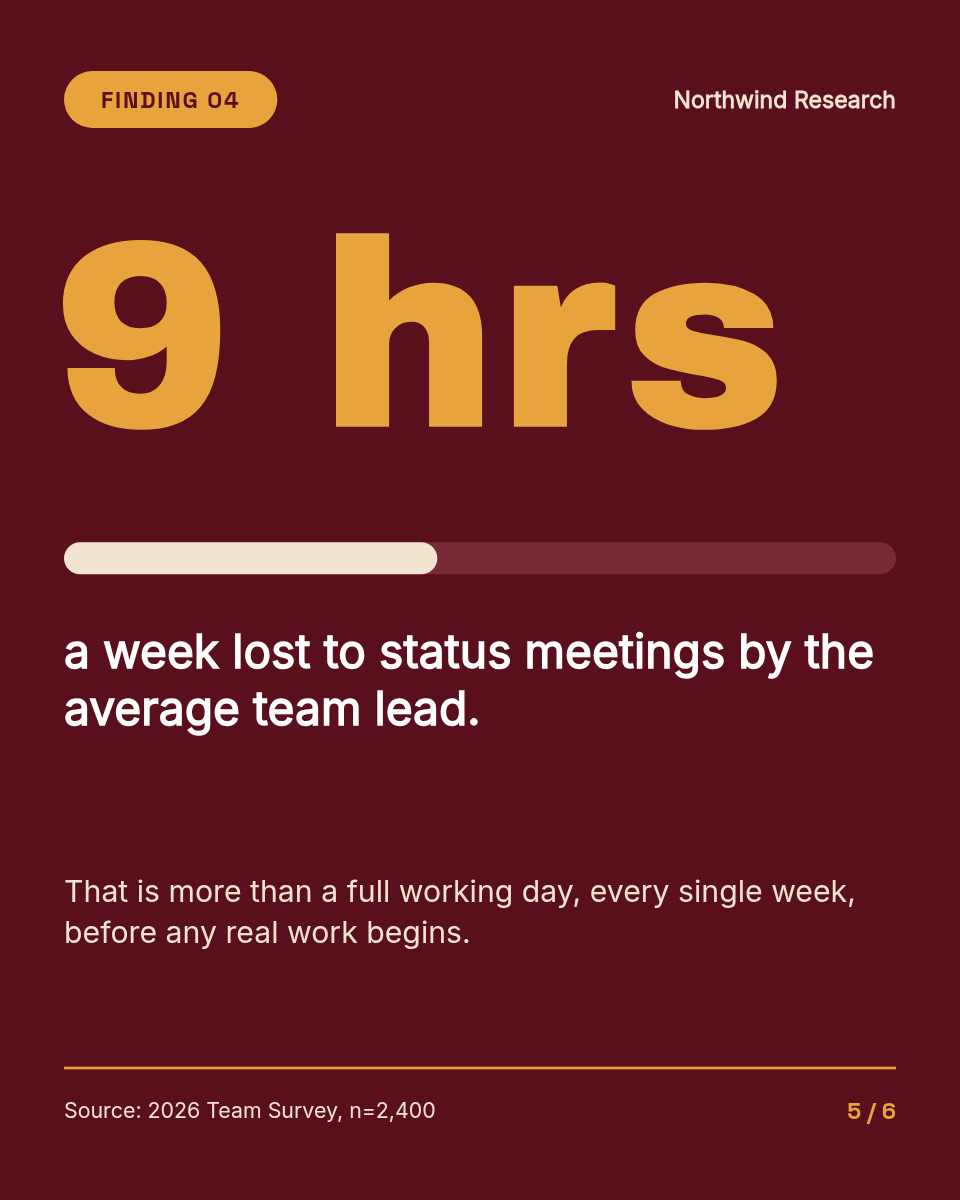
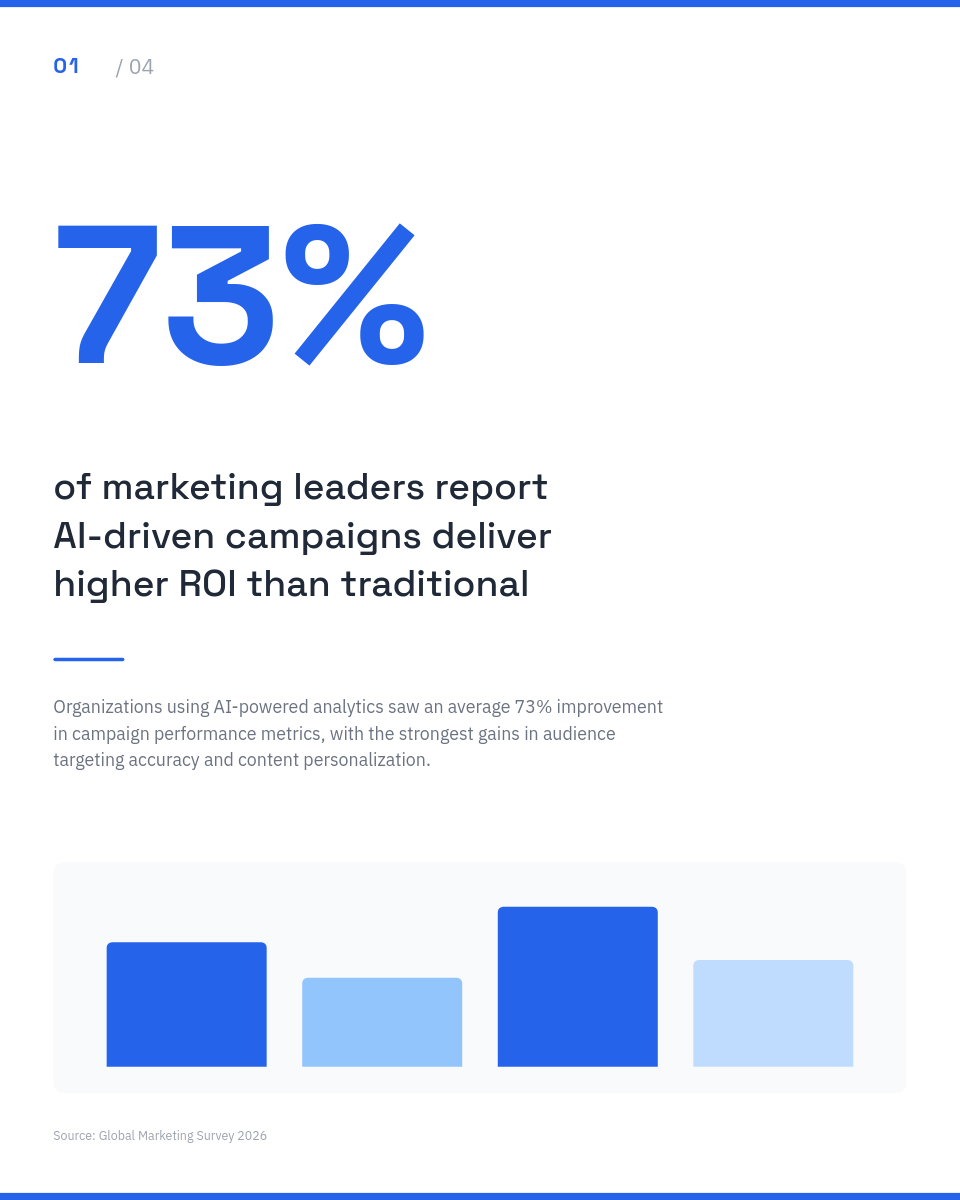
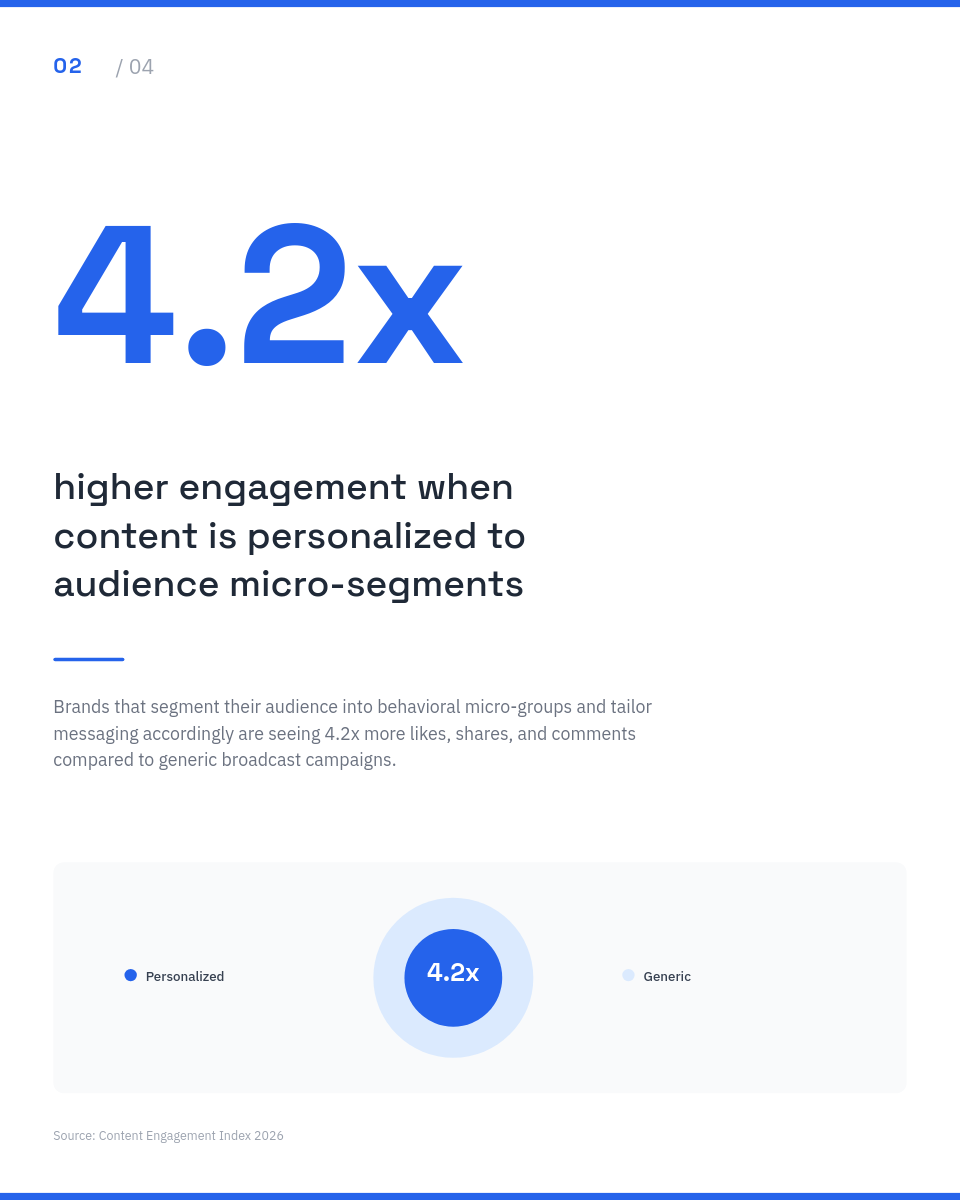
LinkedIn carousel template for data-driven industry insights — 5 slides with bold stat numbers, electric blue accent bars, chart shapes, and source citations.
- 100% customizable in the editor
- Render via API, Zapier, Make & n8n
- Export PNG, JPG, PDF & MP4
- Generate at scale from a spreadsheet
- Remix it with the AI design agent
1 / 5
Automate
Automate this template via API & Agents
Render PNG, PDF and WebP via API, n8n, Make, Zapier or an AI agent.
1Trigger
Receiving data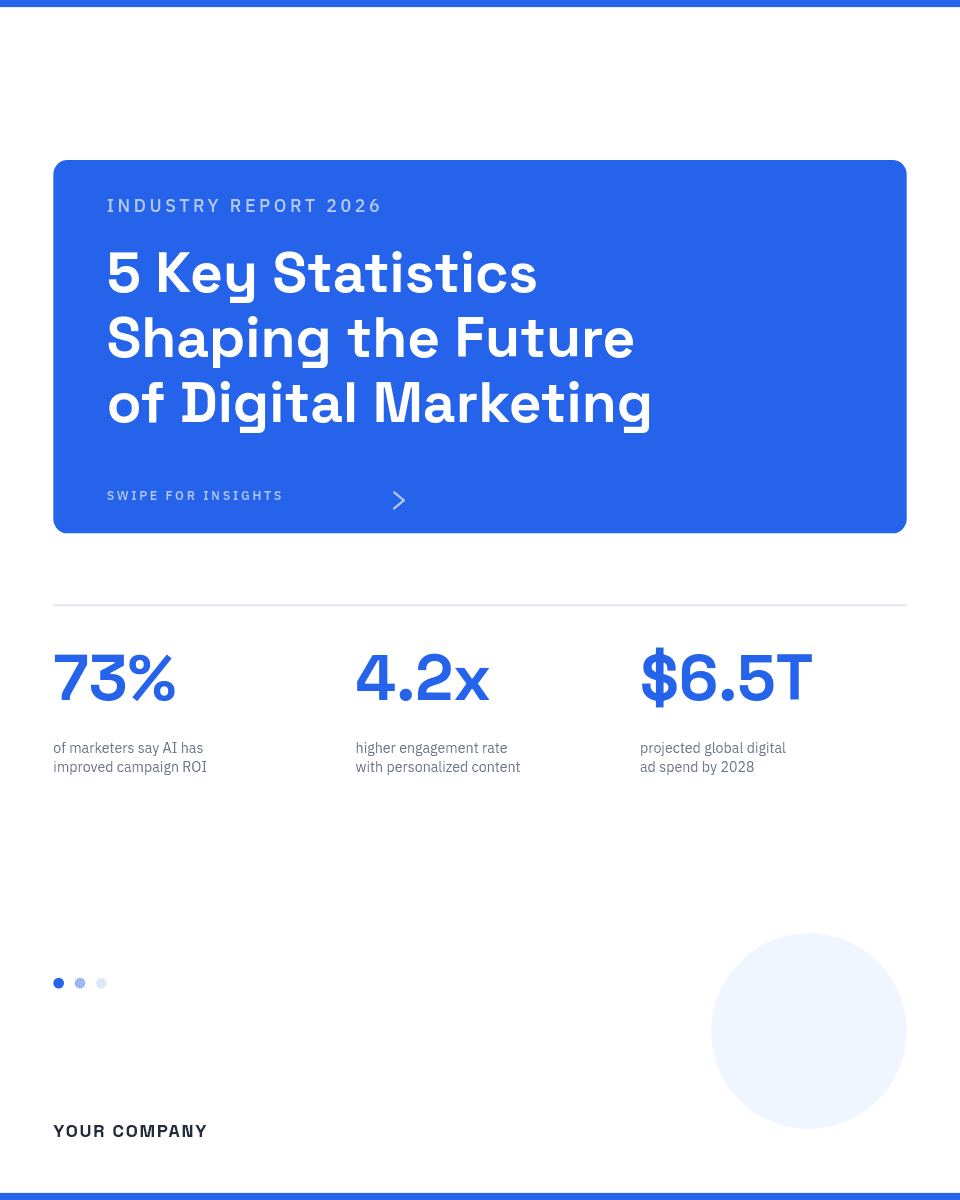
Clean Blue Industry template
- page1@page1@kicker
- INDUSTRY REPORT 2026
- page1@page1@headline
- 5 Key Statistics…
- page1@page1@brand_name
- YOUR COMPANY
3Render and deliver
 Instagramclean-blue-industry.pngpng
- Your backend
 clean-blue-industry.pdfpdf
  LinkedIn
 clean-blue-industry.webpwebp
01
Start from this template
Skip the blank canvas — this design is ready to make your own.
02
Customize it free
Edit text, colors and images in the Orshot editor in minutes.
03
Render or automate
Export instantly, or generate at scale via API, Zapier, Make & n8n.
For developers
Backend Usage
You can generate Clean Blue Industry Statistics Carousel with Large Numbers and Chart Accents renders using Rest API
await fetch("https://api.orshot.com/v1/studio/render", {
  method: "POST",
  headers: {
    "Content-Type": "application/json",
    Authorization: "Bearer <ORSHOT_API_KEY>",
  },
  body: JSON.stringify({
    "templateId": 613,
    "response": {
      "format": "png",
      "type": "base64",
      "scale": 1
    },
    "modifications": {
      "<YOUR_DYNAMIC_PARAMETERS>"
    }
  }),
});