Post a weekly stats card to Buffer from your sheet
Every week the latest row of your stats sheet becomes a numbers card, added to your Buffer queue.
 2Google SheetsRead rows from a spreadsheet.
 5Send to BufferAdd each render to your Buffer queue, schedule it, or save a draft.
Templates for this workflow
Pick one of these, make it yours in the editor, and connect it to the workflow.

Teal Weekly Status Report A4 Document with Progress Table

Weekly Team Status Report with Deliverables Table

Clean Olive Green Weekly Status Report with Metrics Table and Section Headers

LinkedIn Carousel Template — Stat Report, Oxblood & Peach

Sage Green Editorial Watercolor Floral Weekly Plan A4 Document with Cormorant Garamond Italic Display Title, Sage Section Bars, Three Priority Checkboxes, Seven Day Schedule Rows and Reflection Notes Block
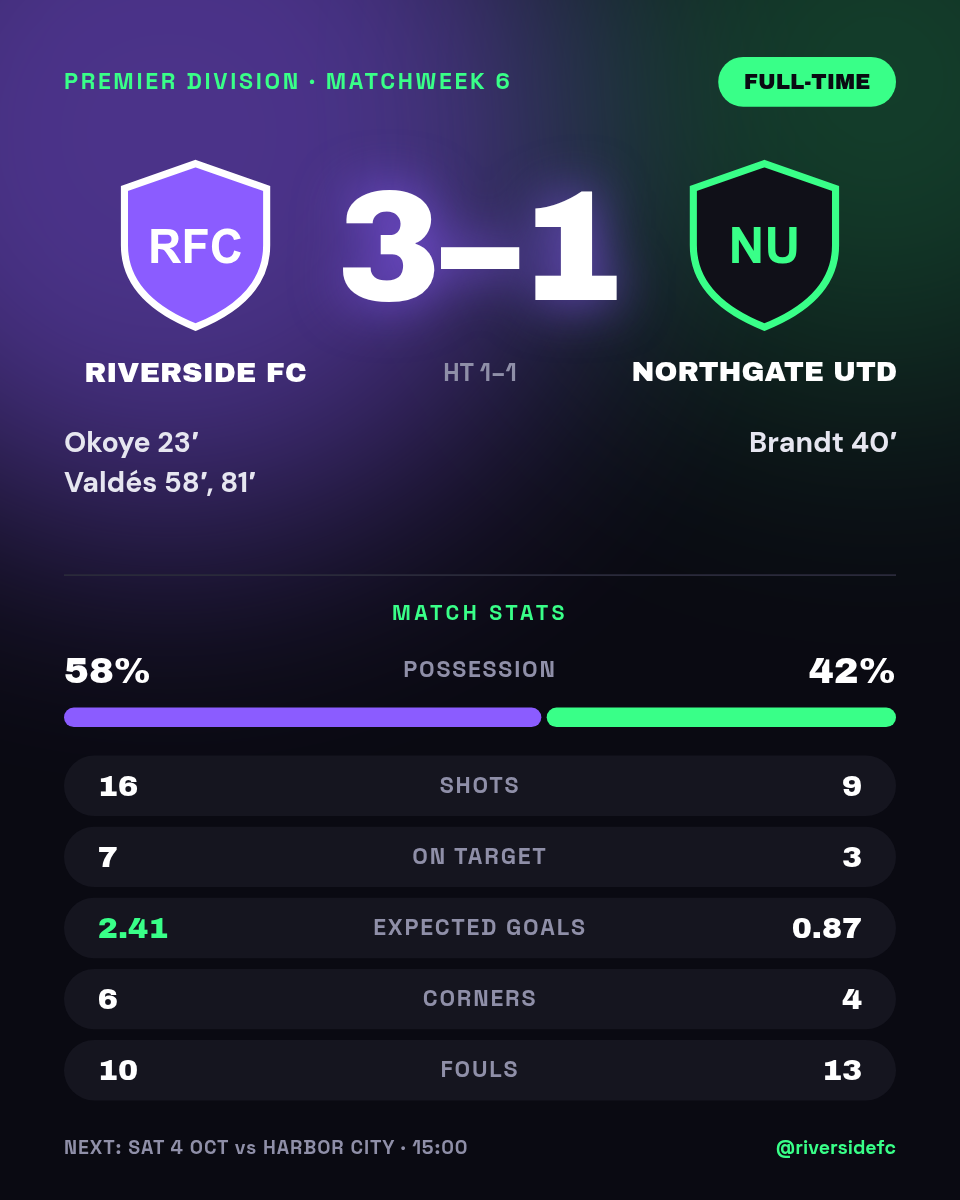
Football Result Card 4:5 — Match Stats, Neon Violet

Editorial Annual Impact Report One-Pager with Hero Photo and KPI Cards

Instagram News Carousel Template — Weekly Recap, Emerald
Related workflows


Give every blog post an on-brand share image
New posts get a matching Open Graph image so links look great everywhere they're shared.

Turn new listings into social-ready cards
Each listing row becomes a polished Instagram and Facebook post, straight from your sheet.
Personalize email header images per recipient
Drop each recipient's name or offer into a hero image for higher email engagement.
Integrations in this workflow
Connect these apps once and the workflow moves your data through them automatically.