How to see how your posts are performing
Impressions, engagement and follower growth for the posts you publish from Orshot, per post or across an account
Published Aug 28, 2026
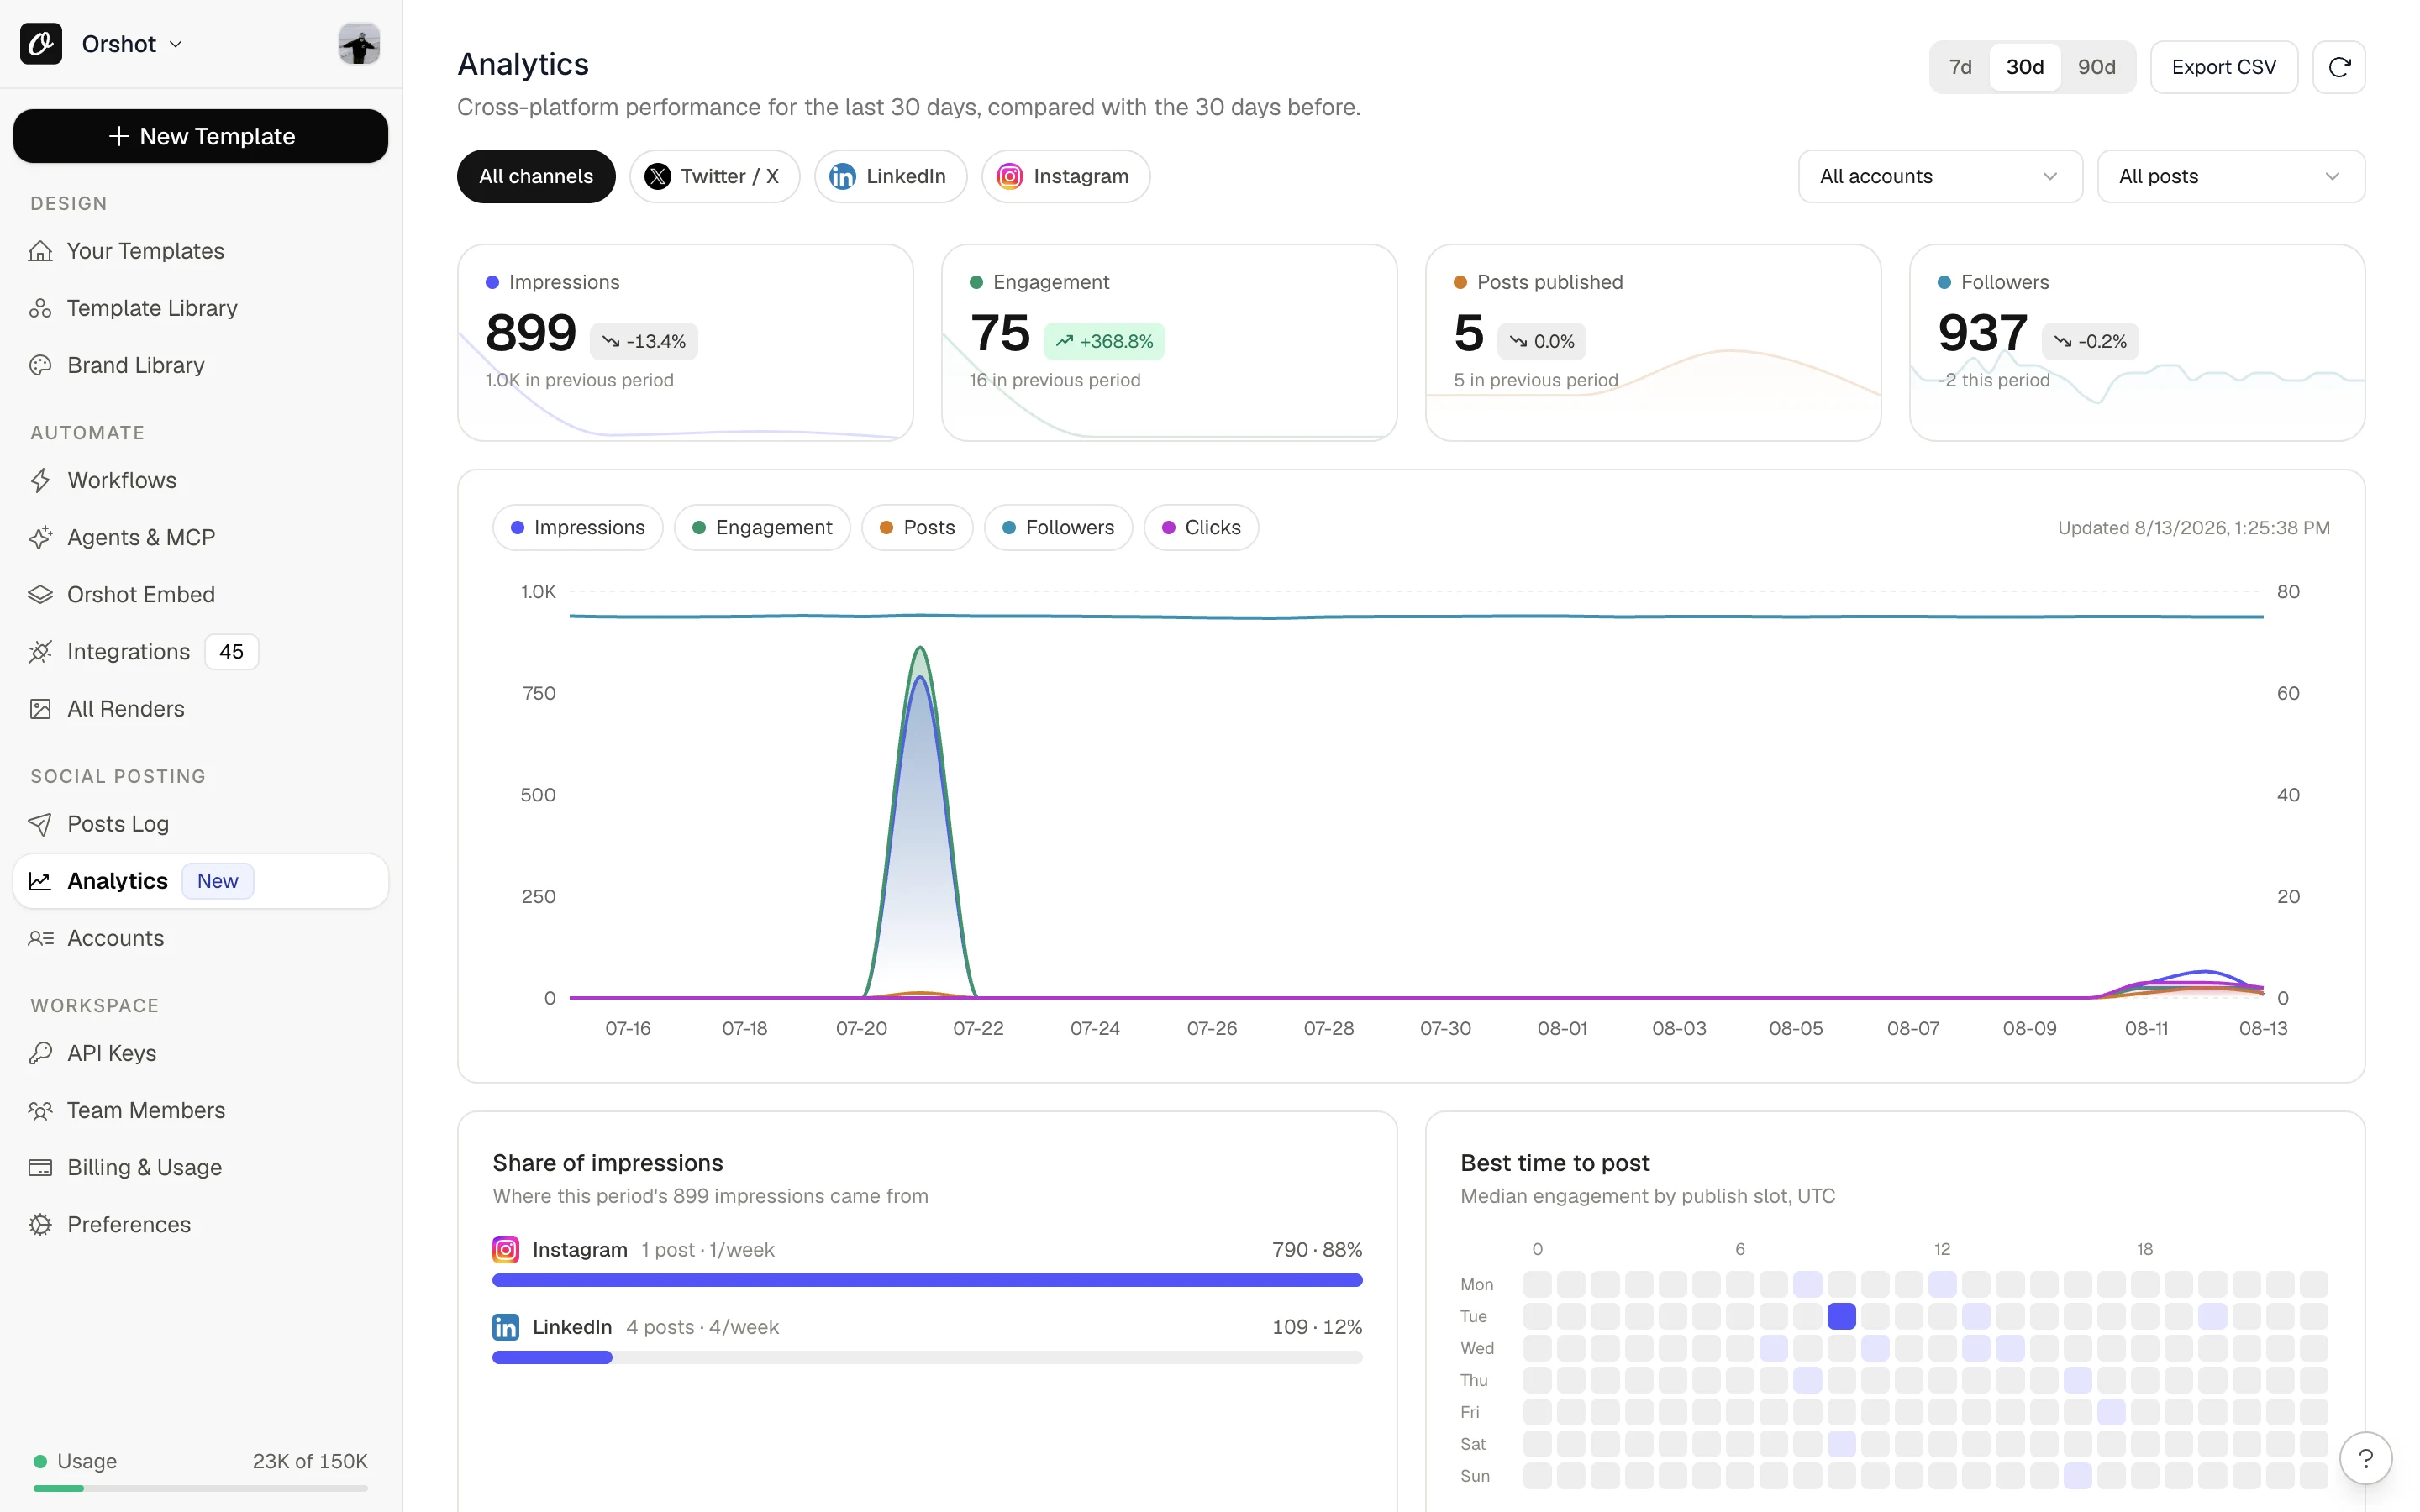
Open Analytics under Social Posting in your workspace sidebar.
The overview#
Pick a range at the top right: 7d, 30d or 90d. Every number is compared with the previous period of the same length.
Four totals sit across the top:
- Impressions: how many times your posts were shown
- Engagement: likes, comments, shares and saves combined
- Posts published: how many went out in the range
- Followers: total across every connected account
Narrow the view with the filters: a single channel, a single account, or a single post. Export CSV downloads whatever the filters are currently showing.
Two panels underneath answer the questions people ask most:
- Share of impressions: which platform actually earned the reach this period
- Best time to post: median engagement by publish slot in UTC, with your peak window named underneath
One post's numbers#
Open Posts Log, then click any published post.
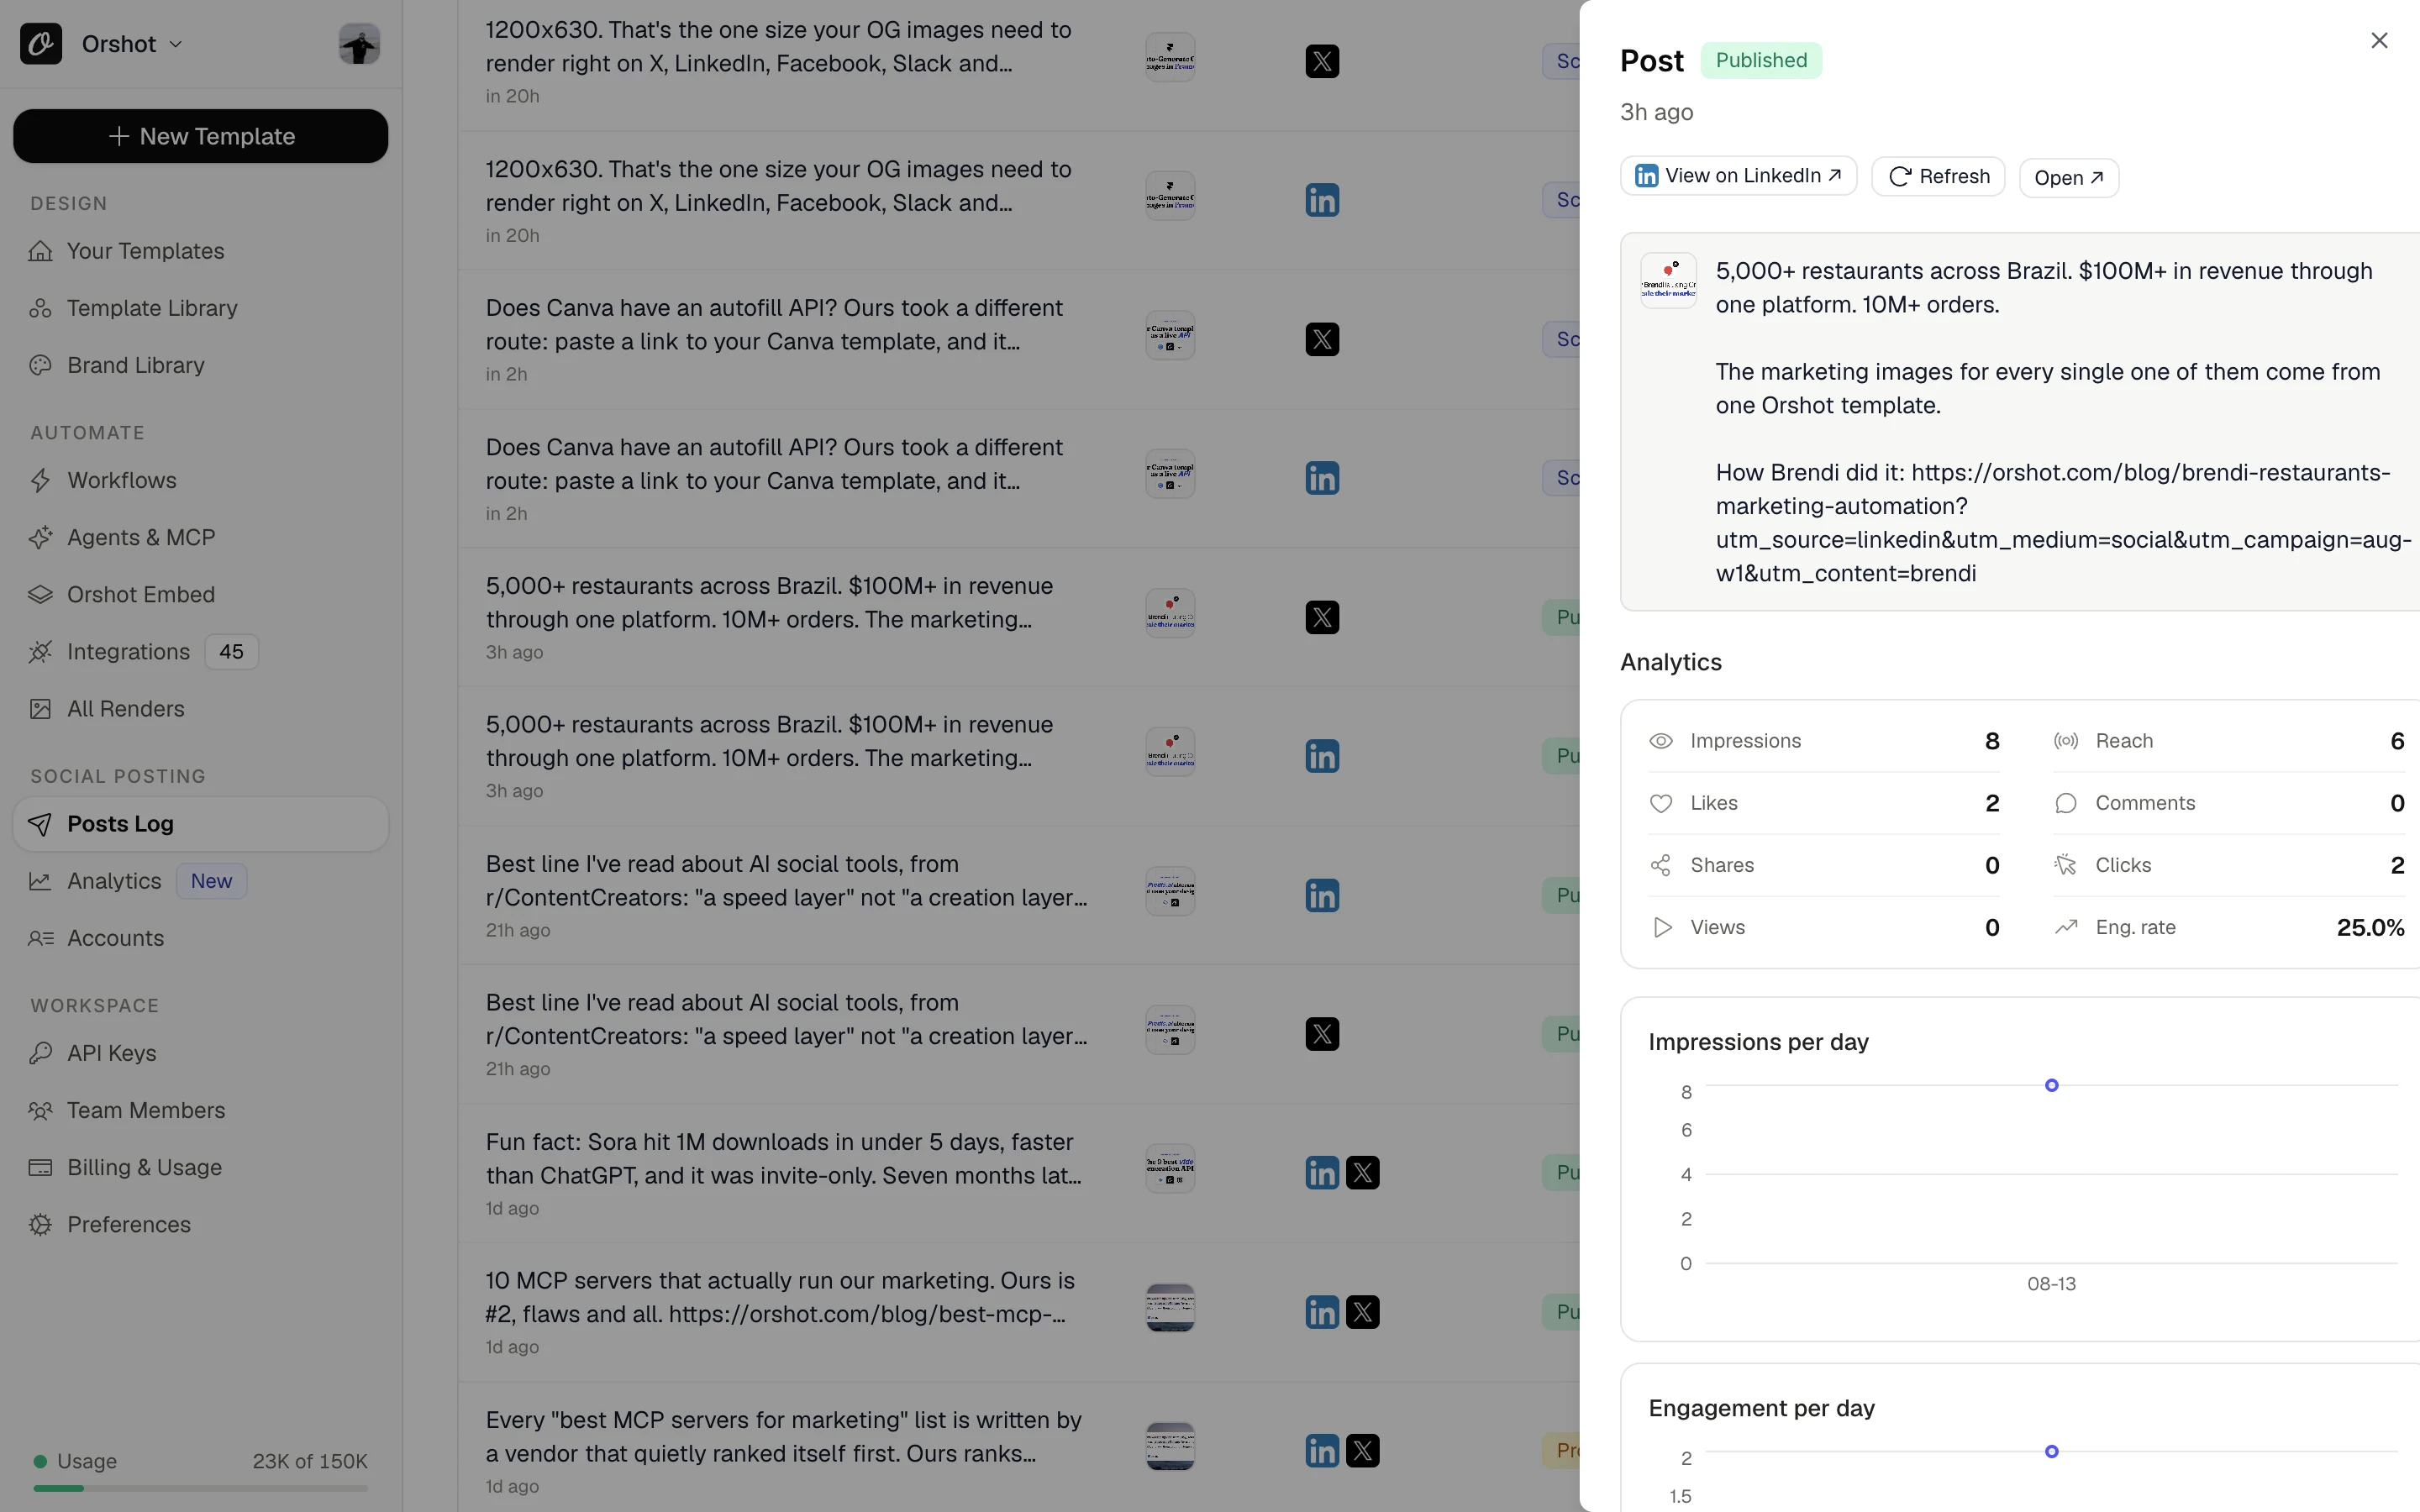
The panel shows that post's impressions, reach, likes, comments, shares, clicks, views and engagement rate, plus a per-day chart for impressions and engagement.
Refresh pulls the latest numbers from the platform straight away.
Missing a metric?
You see whatever each platform reports for that post. Metrics a platform doesn't return simply don't appear, so a blank is a platform limit rather than a problem with your post.
Compare accounts and find top posts#
Scroll further down the Analytics page.
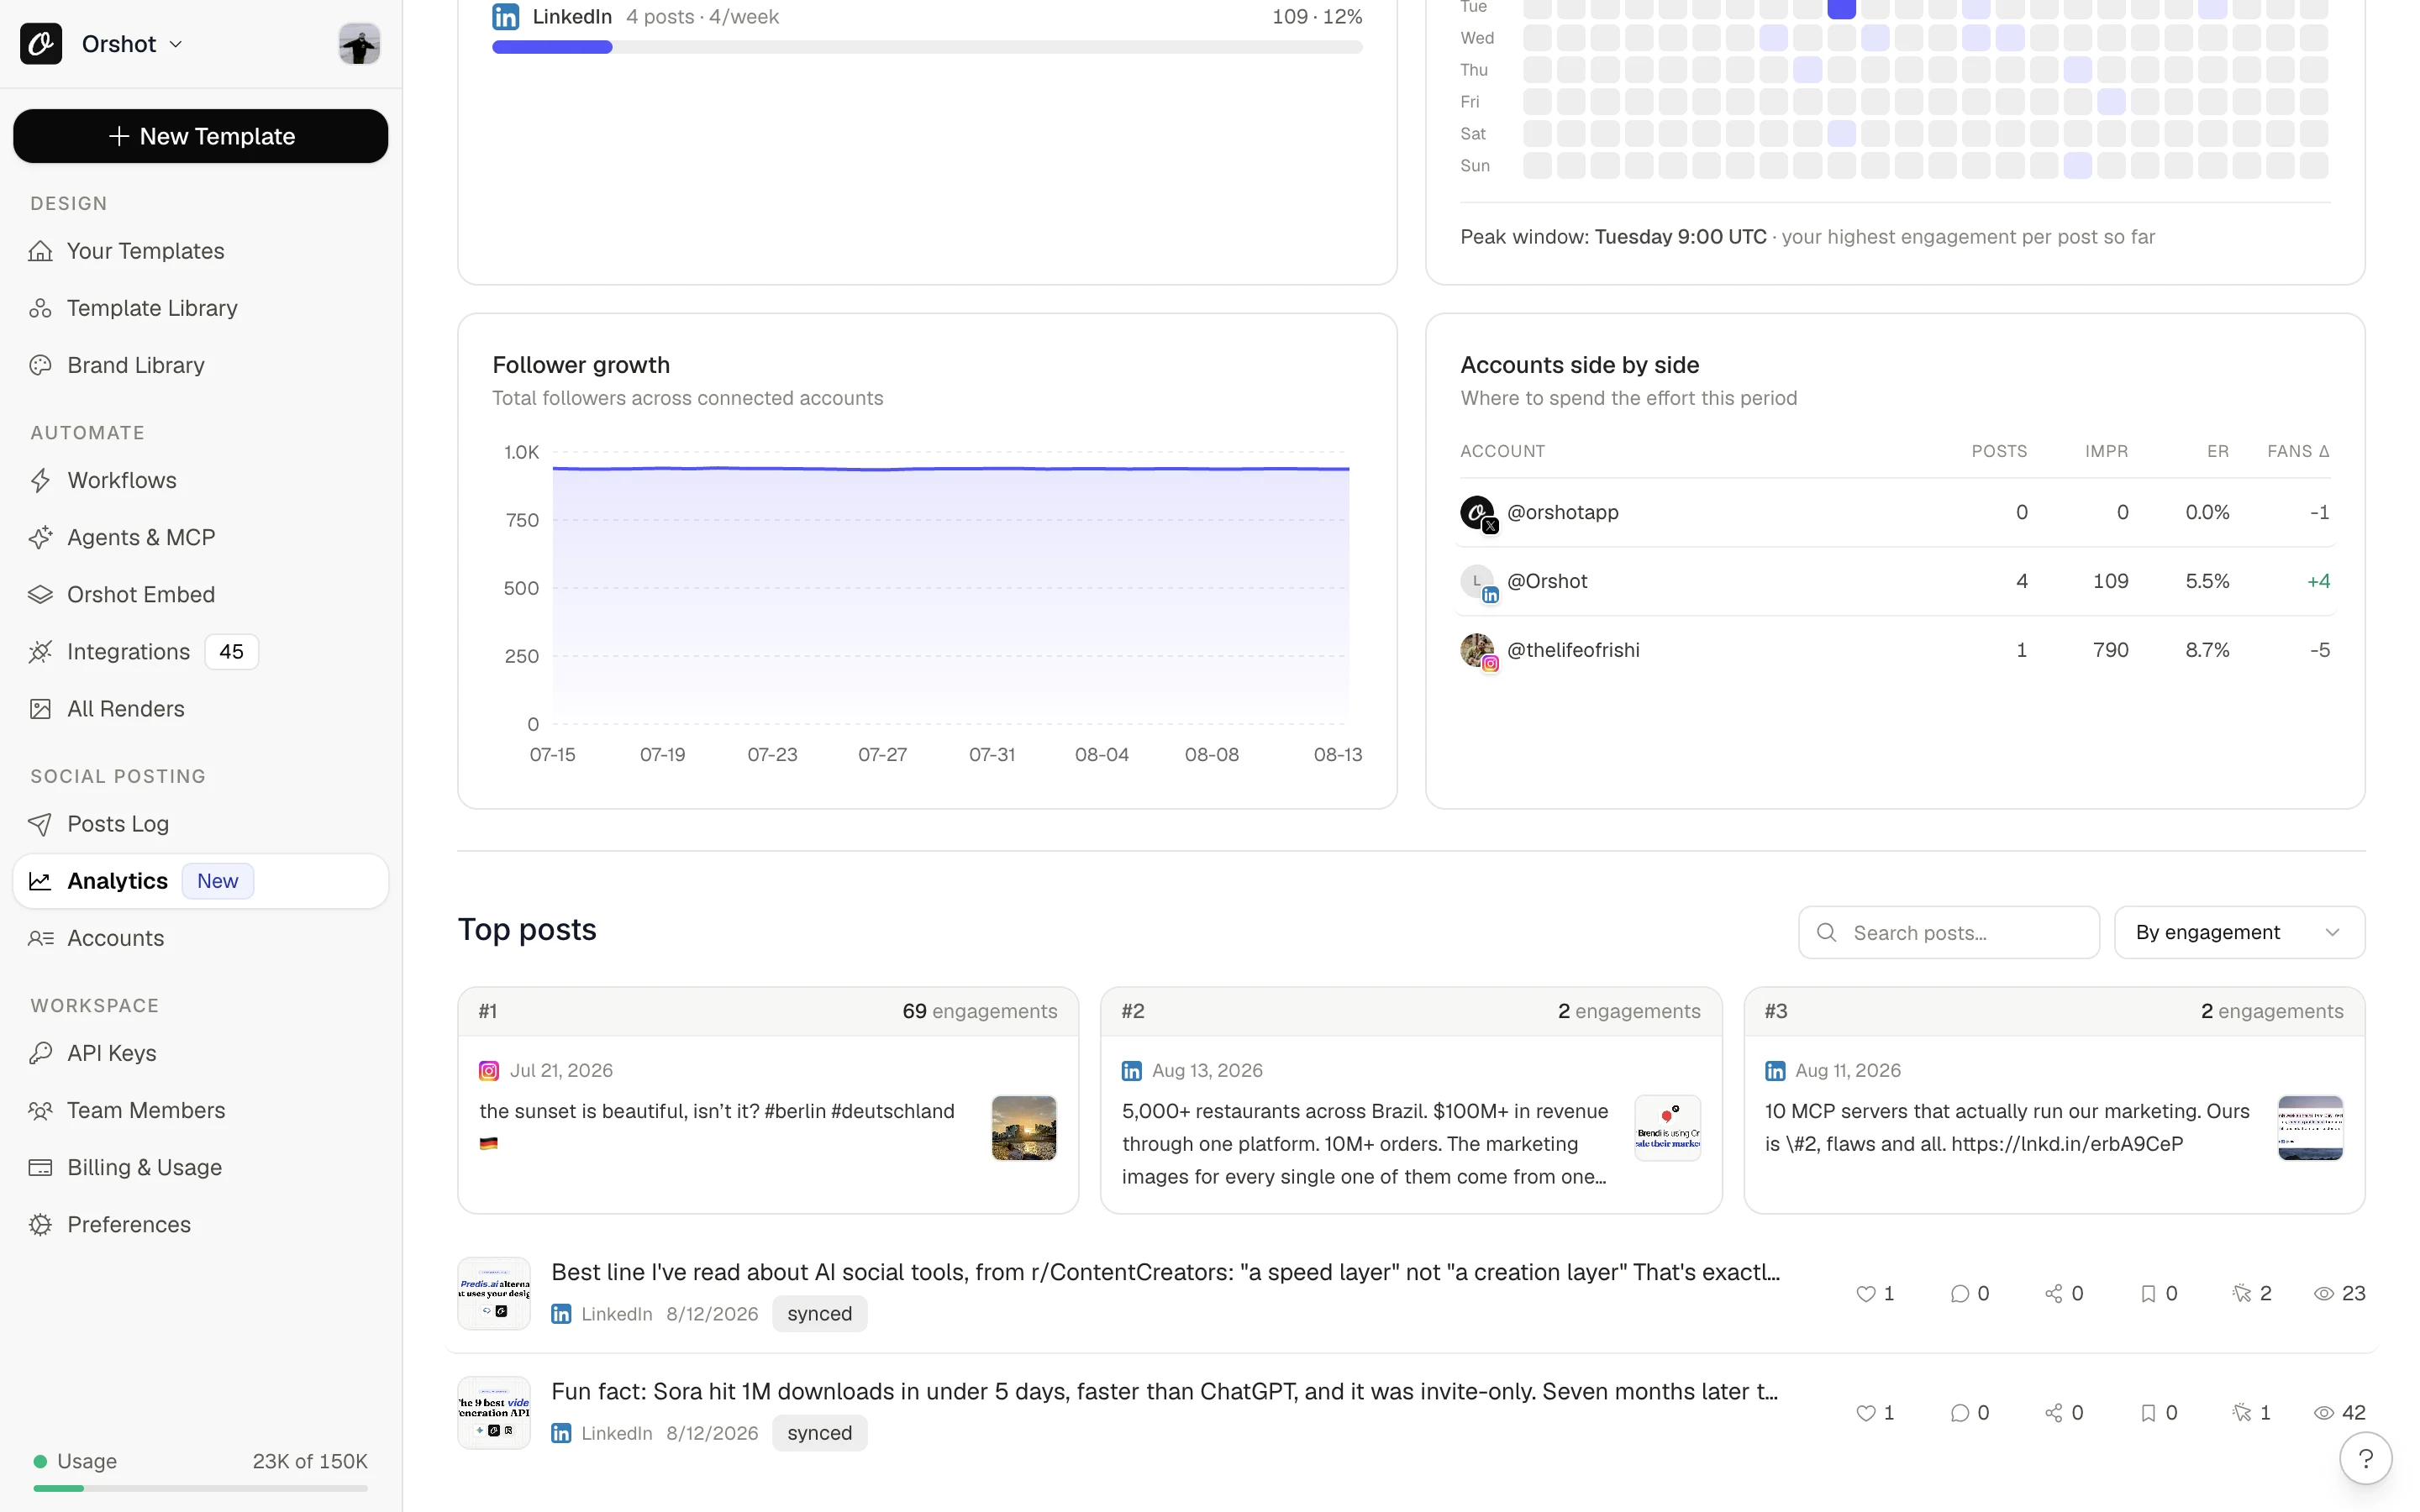
- Follower growth: total followers across connected accounts over the range
- Accounts side by side: posts, impressions, engagement rate and follower change per account, so you can see where the effort is paying off
- Top posts: your best performers, sortable by engagement and searchable
When the numbers update#
Orshot caches platform metrics so the page loads instantly, then refreshes in the background. How stale a number can be before that refresh fires:
| What you're looking at | Refreshes after |
|---|---|
| A single post | 5 minutes |
| Posts Log chips and top posts | 10 minutes |
| The daily chart | 30 minutes |
| Best time to post | 3 hours |
| Follower counts | 1 hour |
Follower counts also depend on each platform's own daily snapshot, so they move once a day rather than continuously. Use Refresh on a post if you need its numbers right now.
Get it by email#
Every workspace that publishes gets a daily digest of yesterday's numbers.
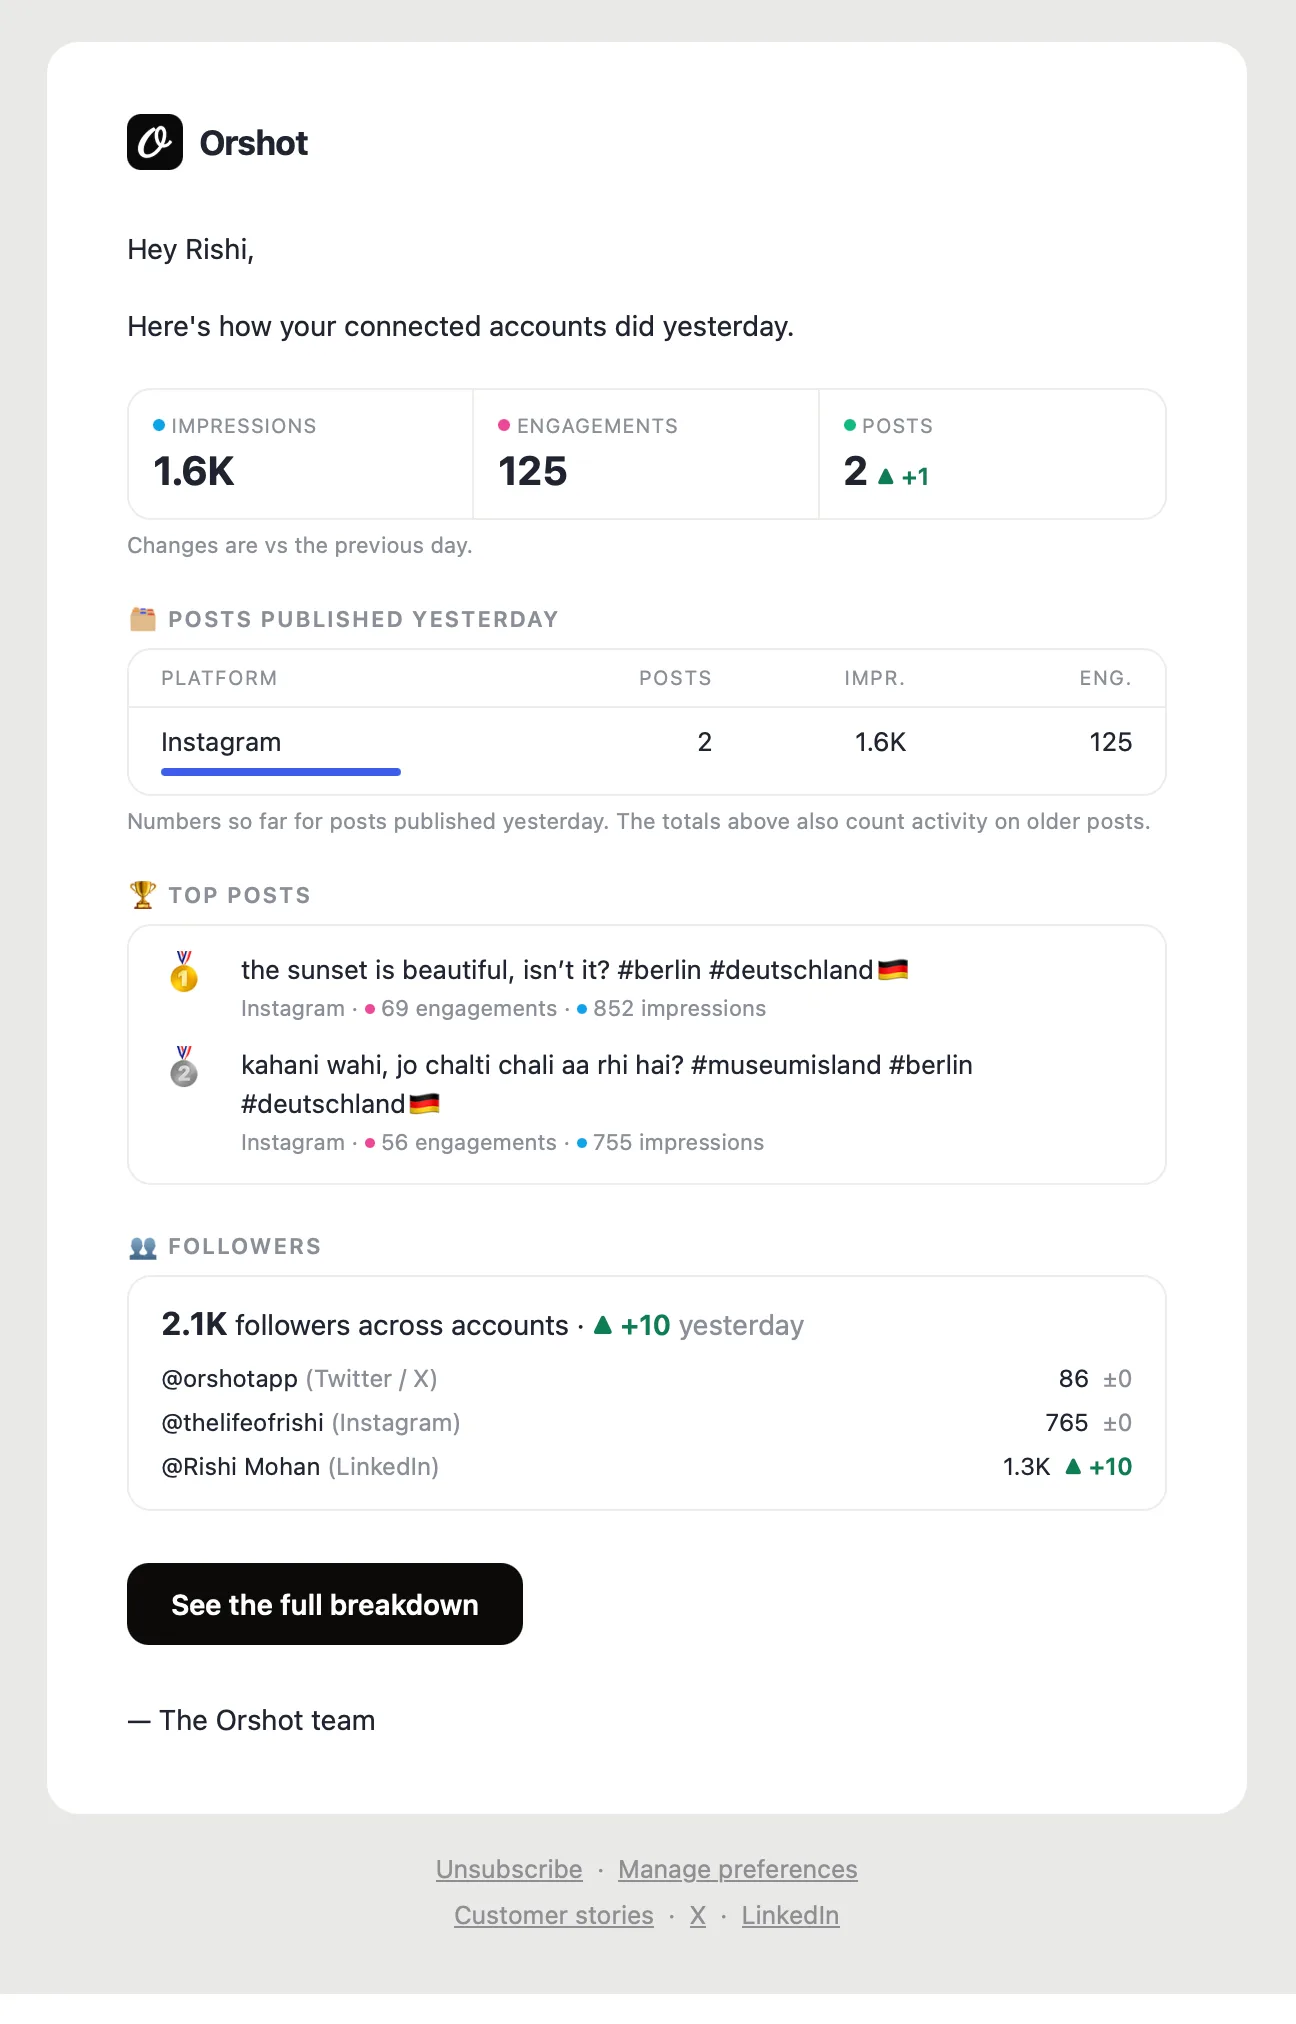
It arrives around 07:40 UTC with impressions, engagements and posts (each against the day before), a per-platform breakdown, your top posts, and follower counts per account.
A few things worth knowing:
- It's on by default. Nothing to set up.
- It goes to the workspace owner.
- Quiet days stay quiet. If nothing published in the last 24 hours and yesterday drew no impressions, no email is sent. A missing digest usually means a quiet day, not a fault.
To turn it off, open Settings → Notifications and switch off Daily Social Digest. Only the workspace owner can change it.
Unsubscribe does more than this one email
The unsubscribe link in the footer opts you out of the whole recap email group, not just the daily digest. Use the setting above if you only want to stop this one.
Related#
More in Publishing
Ready to automate?
Start rendering images, PDFs and videos from your templates in under 2 minutes. Free plan, no credit card.
Get your API key- Image, PDF and video generation via API
- Visual editor with AI and smart layouts
- Zapier, Make, MCP and 40+ integrations
- White-label embed for your own app
- 100 free credits a month, no credit card required